


 16 / 388

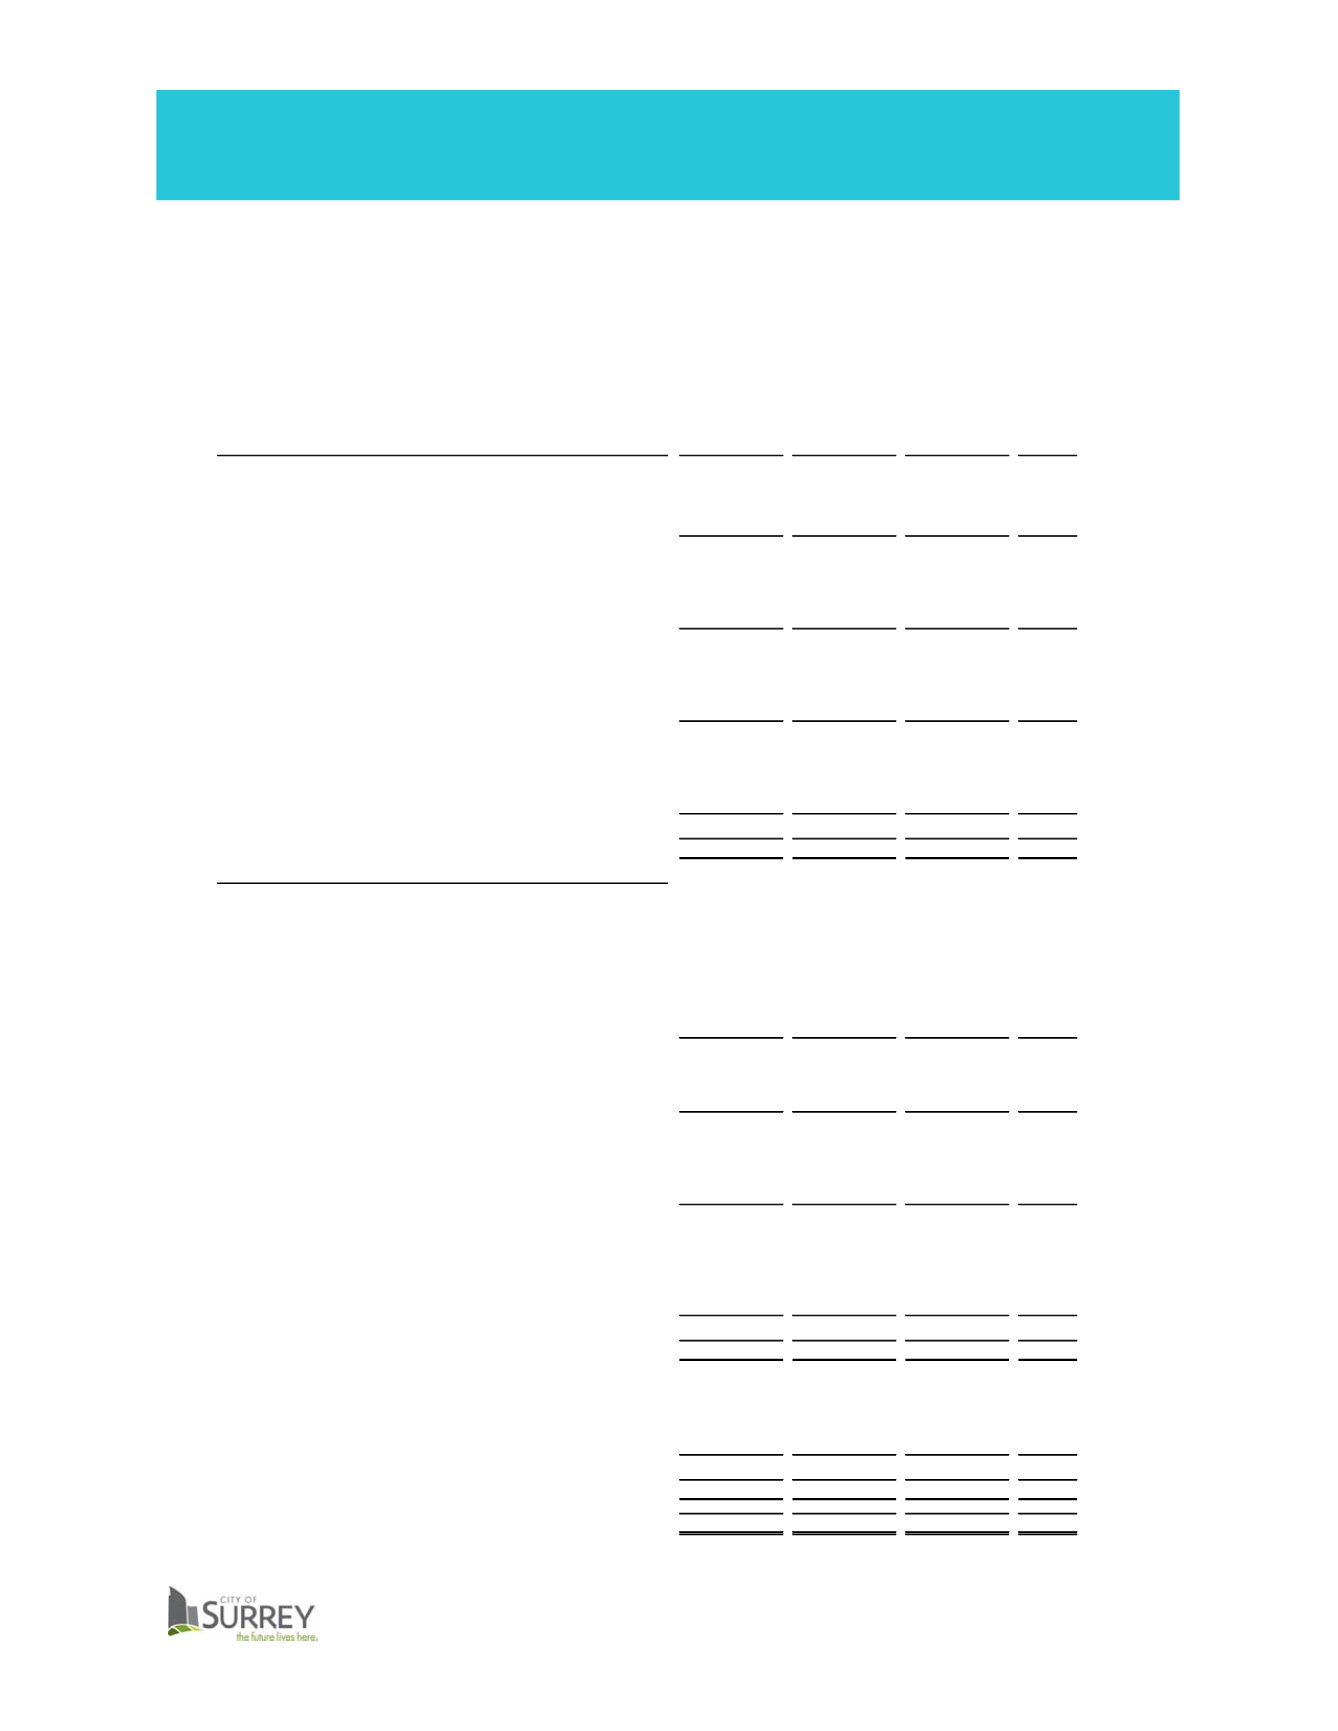
EXECUTIVE OVERVIEW
BUDGET SUMMARY
2017-2021 FINANCIAL PLAN
The 2017 Five Year (2017 - 2021) Financial Plan has been developed based on direction
provided by Council over the course of time and builds on the adopted 2016 Five Year
(2016 - 2020) Financial Plan. The following provides a summary of the 2017 Five Year
Financial Plan. See the General Operating Fund, Utilities Operating Fund and Capital
Program sections for detailed schedules and additional information.
CONSOLIDATED - BUDGET SUMMARY (in thousands)
2016
2017
REVENUE SUMMARY
BUDGET
BUDGET
$
%
General Operating Fund
Taxation
309,642
$
328,802
$
19,160
$
6.2%
Departmental Revenues
79,404
82,642
3,238
4.1%
Other
50,591
57,137
6,546
12.9%
439,637
468,581
28,944
6.6%
Utilities Operating Funds
Taxation
58,635
64,066
5,431
9.3%
Departmental Revenues
158,818
168,148
9,330
5.9%
Other
2,299
2,305
6
0.3%
219,752
234,519
14,767
6.7%
Capital Program
Development Cost Charges
133,486
142,168
8,682
6.5%
Other Development Charges
132,668
135,807
3,139
2.4%
Government Transfers
41,350
41,702
352
0.9%
307,504
319,677
12,173
4.0%
Other
Other Entities
17,015
14,169
(2,846)
-16.7%
Investment Income - Reserves & Capital
2,136
1,212
(924)
-43.3%
Land Sales
5,000
3,000
(2,000)
-40.0%
24,151
18,381
(5,770)
-23.9%
Budgeted Revenues
991,044
$
1,041,158
$
50,114
$
5.1%
EXPENDITURE SUMMARY
General Operating Fund
General Government
40,499
$
43,909
$
3,410
$
8.4%
Public Safety
212,757
227,177
14,420
6.8%
Other Departments
140,315
151,179
10,864
7.7%
Council Initiative Fund
250
250
-
0.0%
Fiscal Services
19,577
22,358
2,781
14.2%
Carbon Emission Offsets
400
400
-
0.0%
Contributions/Transfers to/(from)
25,839
23,308
(2,531)
-9.8%
439,637
468,581
28,944
6.6%
Utilities Operating Funds
Operating Expenditures
185,951
192,075
6,124
3.3%
Contributions/Transfers to/(from)
33,801
42,444
8,643
25.6%
219,752
234,519
14,767
6.7%
Capital Program
Capital Expenditures
434,708
425,820
(8,888)
-2.0%
Contributed Assets
100,000
100,000
-
0.0%
SCDC
63,600
44,546
(19,054)
-30.0%
598,308
570,366
(27,942)
-4.7%
Other
Amortization
116,775
122,987
6,212
5.3%
Other Entities
(46,585)
(30,377)
16,208
-34.8%
Internal Borrowing
(44,700)
(35,772)
8,928
-20.0%
Contributions/Transfers to/(from)
(292,143)
(289,146)
2,997
-1.0%
(266,653)
(232,308)
34,345
-12.9%
Budgeted Expenditures & Transfers per Bylaw
991,044
$
1,041,158
$
50,114
$
5.1%
Reconciliation to Annual Financial Statements:
Tangible Capital Asset expenditures
(598,308)
(570,366)
27,942
-4.7%
Contributions/Transfers (to)/from reserves
330,740
294,032
(36,708)
-11.1%
Municipal Debt
(10,429)
(13,276)
(2,847)
27.3%
(277,997)
(289,610)
(11,613)
4.2%
Expenditures per Financial Statements
713,047
$
751,548
$
38,501
$
5.4%
Excess Revenues Over Expenses per Financial Statements
277,997
$
289,610
$
11,613
$
4.2%
** Excess Revenues Over Expenses is used to fund the acquistion of tangible capital assets
CHANGE
10