


 21 / 388

Sustainability Charter
2017-2021 FINANCIAL PLAN
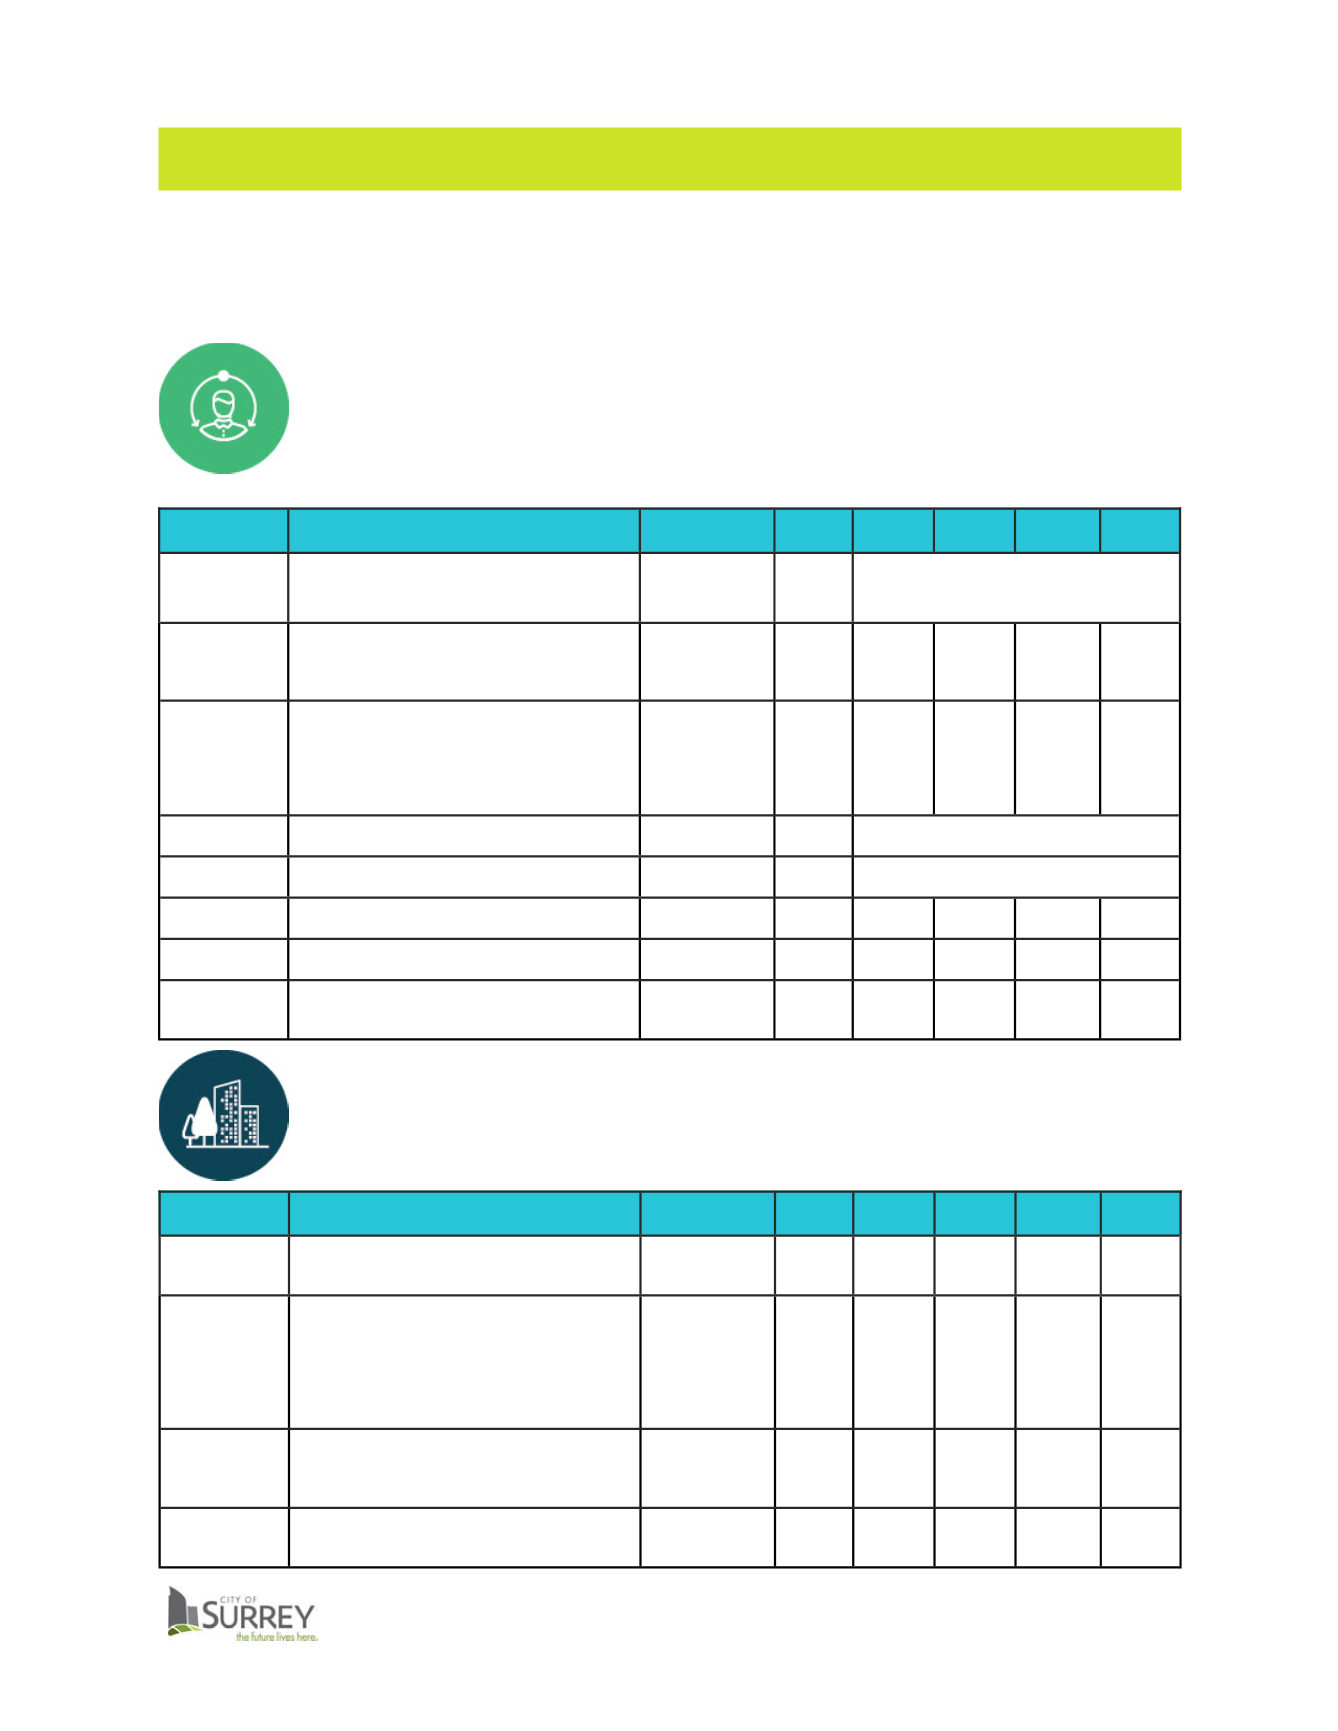
SUSTAINABILITY DASHBOARD— KEY PERFORMANCE INDICATORS
Indicator
Performance Indicator Description
Targets
(Where Set)
2011
2012
2013
2014
2015
Child Poverty
Percentage of children and youth living in
families with income below the Low Income
Cut Off (LICO)
Trend Down
18.7%
(2010 Stats
Canada—
LIM-AT)
Next Stats Canada data available for 2016
City Volunteers
Number of residents who are active and
approved volunteers with the RCMP, Fire
Services, Surrey Libraries, Emergency
Program, and PRC Department
Up by 2% each
year
3,038
4,110
3,847
4,098
3,228
Early Childhood
Vulnerability
Percentage of Children that are vulnerable in
at least one of these five scales: Physical
Health and Well Being; Social Competence;
Emotional Maturity; Language and Cognitive
Development; Communication and General
Knowledge.
Trend Down
32%
34%
34%
34%
34%
Licensed Child
Care Spaces
Licensed daycare spaces per capita (0-12 year
olds)
Trend Up
8.5%
Core Housing
Need
Tenant-occupied households spending 30%
or more of household income on gross rent
Trend Down
37.7%
Next data available for 2016
Social Housing
Units
Number of Non-Market Social Housing Units
No Target
N/A
5,434
N/A
N/A
5,699
Homelessness Number of homeless in Surrey
No homelessness
by 2032
400
N/A
N/A
403
N/A
City Grant
Programs
Number of Grants provided by: (1) Cultural
Grants program, and (2) Neighbourhood
Enhancement Grant program
No Target
N/A
N/A
47
47
70
Next data available for 2016
Diversity and Accessibility
Poverty Reduction
Housing
Age-Friendly Community
Community Pride and Engagement
Social infrastructure and Innovation
INCLUSION
DESIRED OUTCOMES:
BUILT ENVIRONMENTS AND NEIGHBOURHOODS
DESIRED OUTCOMES:
Neighbourhoods and Urban Design
Buildings and Sites
Indicator
Performance Indicator Description
Targets
(Where Set)
2011
2012
2013
2014
2015
Density on
Transit
Corridors
Residential and employment density on
transit corridors (people or jobs per acre)
Trend Up
N/A
N/A
Proximity of
Residential Units
to Amenities
Percentage of households within walking
distance (400m) of various amenities.
By 2022, average
of 68.625% of
households
within walking
distance (400m)
of various
amenities.
N/A
N/A
N/A
48.75
(Average)
49.25
(Average)
N/A
14.96
(Average)
15.56
(Average)
Renewable
Energy in City
District Energy
System
Carbon Intensity in City’s District Energy
System (CO2/GJ)
0.07T CO2e/MWh
metered
N/A
N/A
N/A
0.216T
CO2e /
MWh
0.216T
CO2e /
MWh
Proximity to
Frequent Transit
Networks
Percentage of City population living within
400m of Frequent Transit Networks (FTN)
Regional average
for FTN access
N/A
N/A
N/A
28%
28%
The following is a summary of the various indicators found on the dashboard to gauge
the progress Surrey is taking to move toward its vision of a better world.
15