
Sustainability Charter
2017-2021 FINANCIAL PLAN
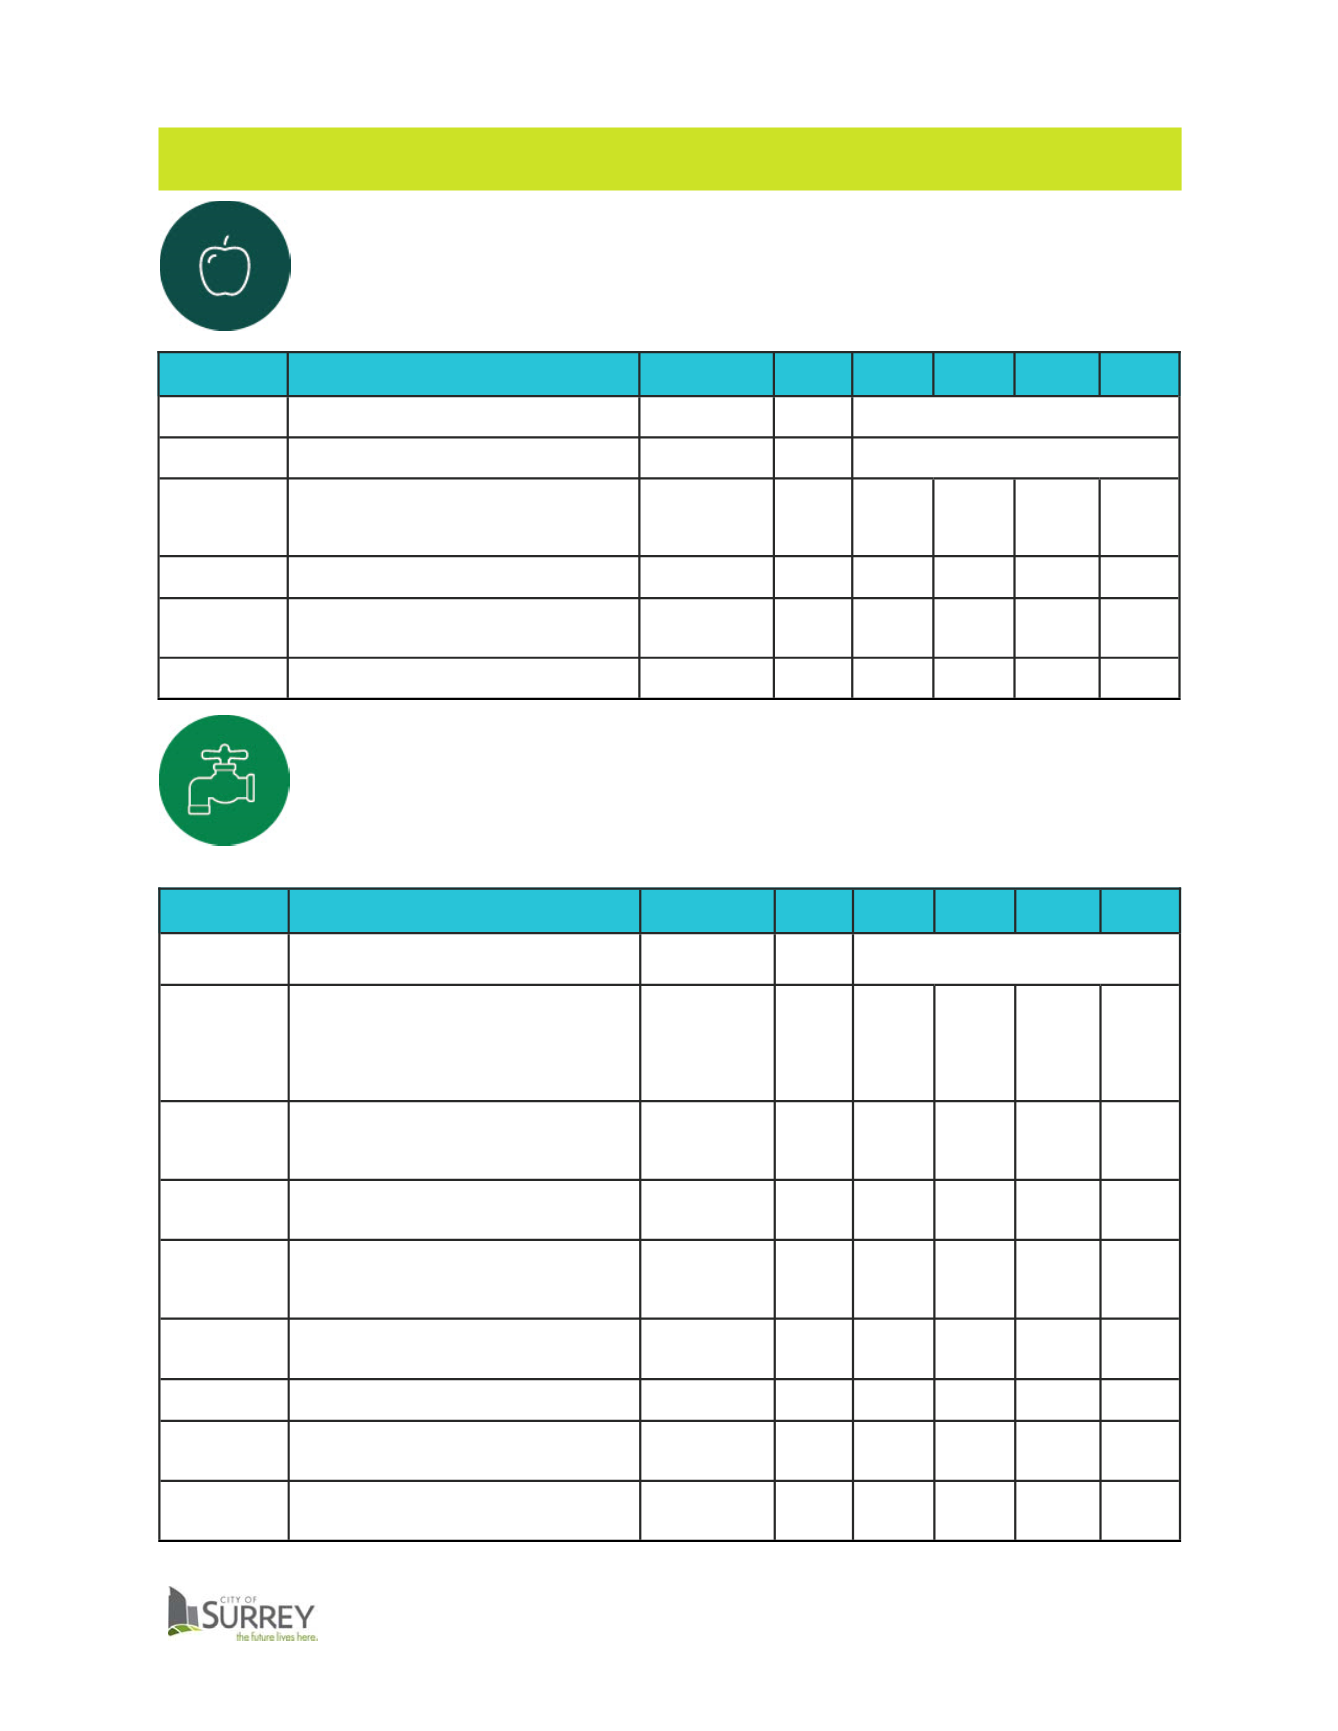
Indicator
Performance Indicator Description
Targets
(Where Set)
2011
2012
2013
2014
2015
Land in Food
Production
Total area of farmland for food production
compared to total area farmed
No net loss of
land in food Prod. 4,294
Next data available for 2016
Land Available
for Farming
Percentage of Agricultural Land Reserve
(ALR) available for farming
No net loss of
ALR for farming
79%
Registration in
City Programs
Registration in programs for children, youth,
and adults offered by the City’s Parks,
Recreation and Culture Department and
Surrey Public Libraries
No Target
N/A
N/A
N/A
2,808,053 3,077,012
Community
Gardens
Number of garden plots in community
gardens on City lands
Trend Up
301
301
291
368
368
Availability of
Doctors
Doctors per 100,000 residents for Surrey, on
par with other major urban centres in the
Province
On par with other
urban centres in
BC
127
133
133
137
142
Current Smokers Percentage of population 12 years and older
that are daily or occasional smokers
Trend Down
13.3%
N/A
12.3%
N/A
N/A
Next data available for 2016
INFRASTRUCTURE
DESIRED OUTCOMES:
All Infrastructure
Energy and Climate
Transportation
Water
Materials and Waste
Telecommunications
Indicator
Performance Indicator Description
Targets
(Where Set)
2011
2012
2013
2014
2015
Mode of Travel
to Work
Mode of Travel to Work by Employed Labour
Force
No Target
Walk 0.3%
Cycle 2.6%
Community
Greenhouse Gas
(GHG) Emissions
Total and Per Capita Community-wide
Greenhouse Gas (GHG) Emissions from
Buildings and Transportation
33% per capita
reduction from
baseline (2007) by
2020; 80% per
capita reduction
by 2050
N/A
2,368,466
N/A
N/A
N/A
Corporate
Greenhouse Gas
(GHG) Emissions
Total Corporate Greenhouse Gas (GHG)
Emissions, for Buildings and Fleet
20% reduction
from baseline
(2005-2009
average) by 2020
19,013
18,197
15,775
16,174
16,401
Walking and
Cycling
Infrastructure
Total kilometers of recreational and cycling
trails (green-ways, on-street bike lanes, park
paths and trails)
Trend Up
546
575
630
646
667
Residential
Water
Consumption
Annual Average Residential Water
Consumption, per capita
270 litres/capita/
day by 2028; 240
litres/capita/day
by 2058
319
322
320
305
299
Community
Waste Diversion
Rates
Percentage of household waste diverted from
the landfill
80% by 2020
50%
57%
71%
70%
70%
Internet
Connectivity
Number of Internet connections per 100,000
people
Trend Up
86.8%
89.1%
N/A
N/A
N/A
Water Quality
Percentage of water courses meeting
provincial Water Quality standards (for water
courses monitored by the City)
100% meeting
established
Guidelines
N/A N/A N/A
20.31%
(Average)
23.44%
(Average)
Drinking Water
Quality
Percentage of drinking water tests meeting
Water Quality Guidelines
100% meeting
established
Guidelines
N/A N/A
100%
100%
100%
Next data available for 2016
HEALTH AND WELLNESS
DESIRED OUTCOMES:
Health Services and Programs
Wellness and Recreation
Food Accessibility and Capacity
Building
18


