


 2 / 191

2010 Best
Practices Study
Agencies
with Revenues
Under $1,250,000
2
Analysis of Agencies with Revenues Under $1,250,000
Mgmt. Perspectives
Profile
Revenues
Expenses
Profitability
Employee Overview
Producer Info
Staff Service Info
Technology
Insurance Carriers
Appendix
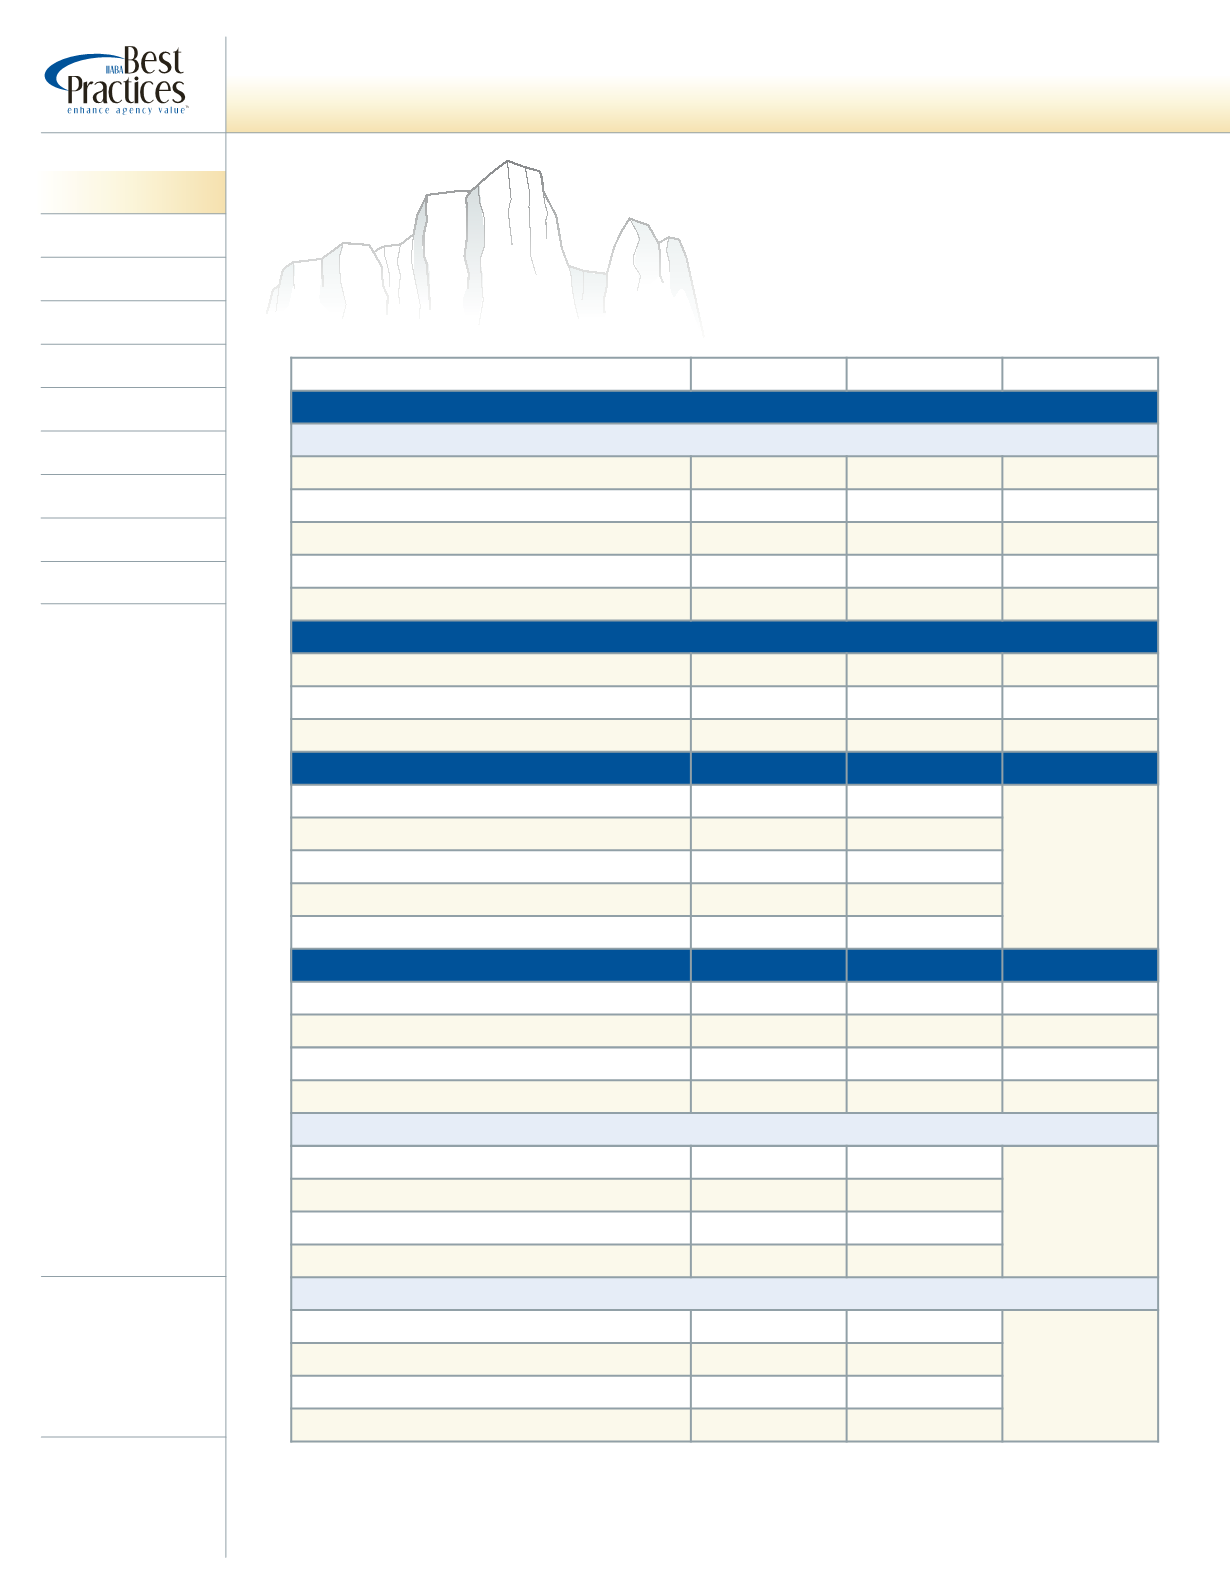
Key Benchmarks at a Glance
Average
+25% Profit
+25% Growth
Growth
Organic Growth By Line of Business**
Commercial P&C
0.7%
0.9%
9.6%
Personal P&C
4.5%
7.1%
8.5%
Group Medical
-4.9%
-14.1%
-11.2%
All Other Group
*
*
*
Total Organic Growth
2.0%
0.7%
13.0%
Profit
Pro Forma Pretax Profit
25.1%
43.2%
25.8%
Pro Forma EBITDA
27.5%
43.8%
27.6%
Rule of 20 Score
16.3
21.7
30.6
Financial
Average
Top 25%
Current Ratio
1.03:1
1.84:1
Receivable/Payable Ratio
88.7%
10.1%
Accounts Receivables > 60 Days
36.1%
6.2%
Accounts Receivables > 90 Days
20.7%
2.7%
Productivity
Average
+25% Profit
+25% Growth
Revenue per Employee
$124,669
$158,089
$114,805
Compensation per Employee
$68,403
$71,402
$59,413
Spread per Employee
$56,267
$86,687
$55,392
Annual New Commission Generated per Validated Producer
Average
Top 25%
Commercial P&C
$37,590
$73,761
Personal P&C
$20,175
$34,892
Life & Health/Financial
$21,974
$41,875
Commissions Serviced per Service & Sales Support Staff
Average
Top 25%
Commercial P&C
$197,492
$401,168
Personal P&C
$150,150
$330,738
Life & Health/Financial
$116,003
$166,297
*Insufficient Data
**Excludes any acquired revenue