


 10 / 56

18
1
The Basics
Time and Voltage
The waves that appear on an EKG primarily reflect the electrical
activity of the
myocardial cells
, which make up the vast bulk of the
heart. Pacemaker activity and transmission by the conducting system
are generally not seen on the EKG; these events simply do not
generate sufficient voltage to be recorded by surface electrodes.
The waves produced by myocardial depolarization and
repolarization are recorded on EKG paper and, like any wave, have
three chief characteristics:
1.
Duration
, measured in fractions of a second
2.
Amplitude
, measured in millivolts (mV)
3.
Configuration
, a more subjective criterion referring to the shape
and appearance of a wave
EKG Paper
EKG paper is a long, continuous roll of graph paper, usually pink
(but any color will do), with light and dark lines running vertically
and horizontally. The light lines circumscribe small squares of 1 × 1 mm;
the dark lines delineate large squares of 5 × 5 mm.
The horizontal axis measures time. The distance across one small
square represents 0.04 seconds. The distance across one large square is
five times greater, or 0.2 seconds.
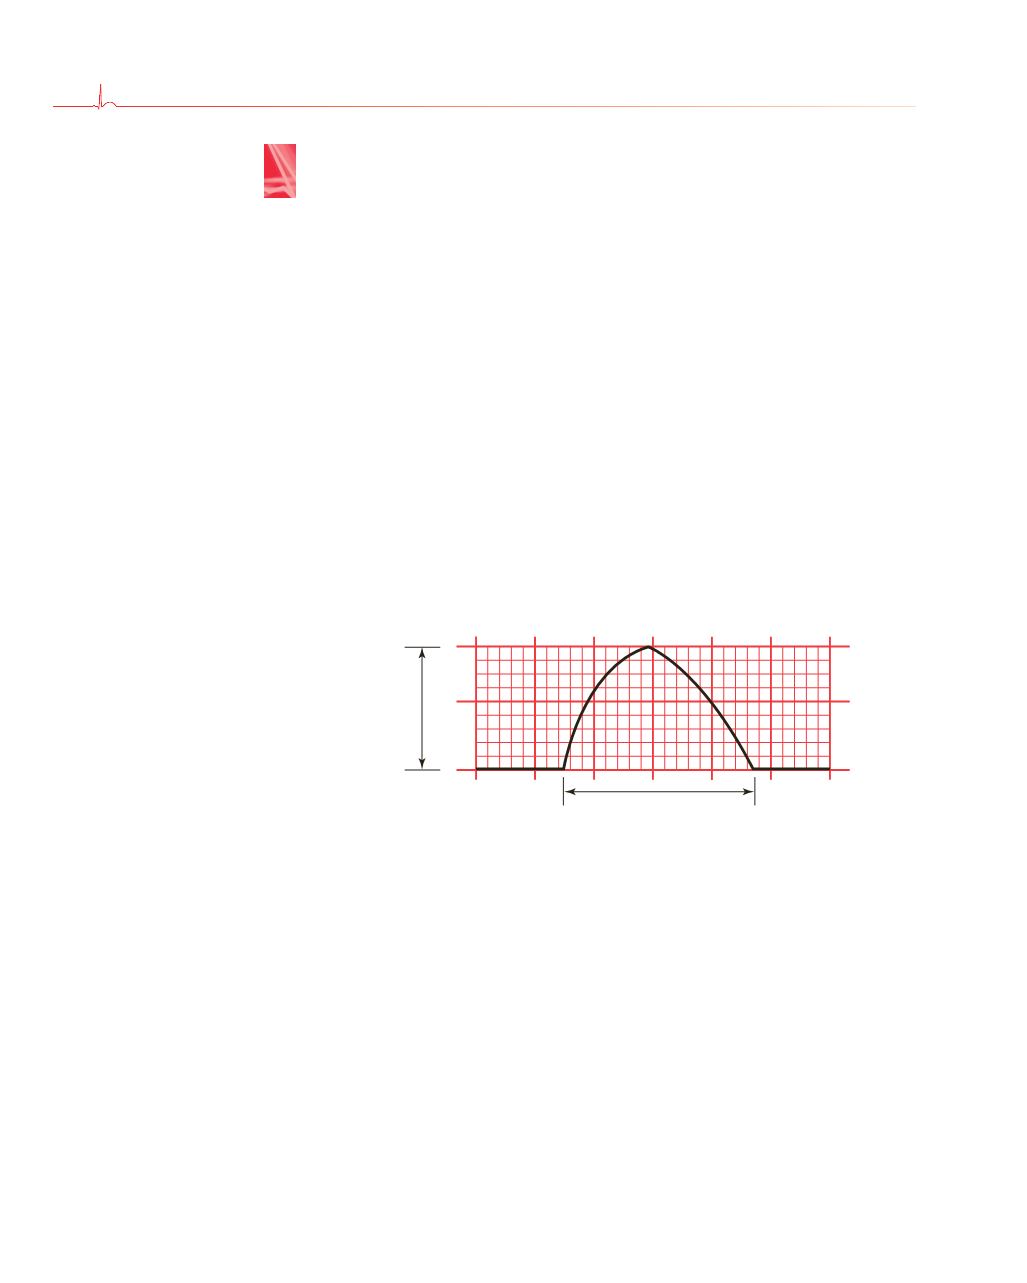
Duration
(fractions of a second)
Amplitude
(millivolts)
A typical wave that might be seen on any EKG. It is two large squares
(or 10 small squares) in amplitude, three large squares (or 15 small
squares) in duration, and slightly asymmetric in configuration.