


 41 / 88

ECONOMIC REPORT 2015
41
0
5
10
15
20
25
30
35
January
2014
May
2014
September
2014
January
2015
May
2015
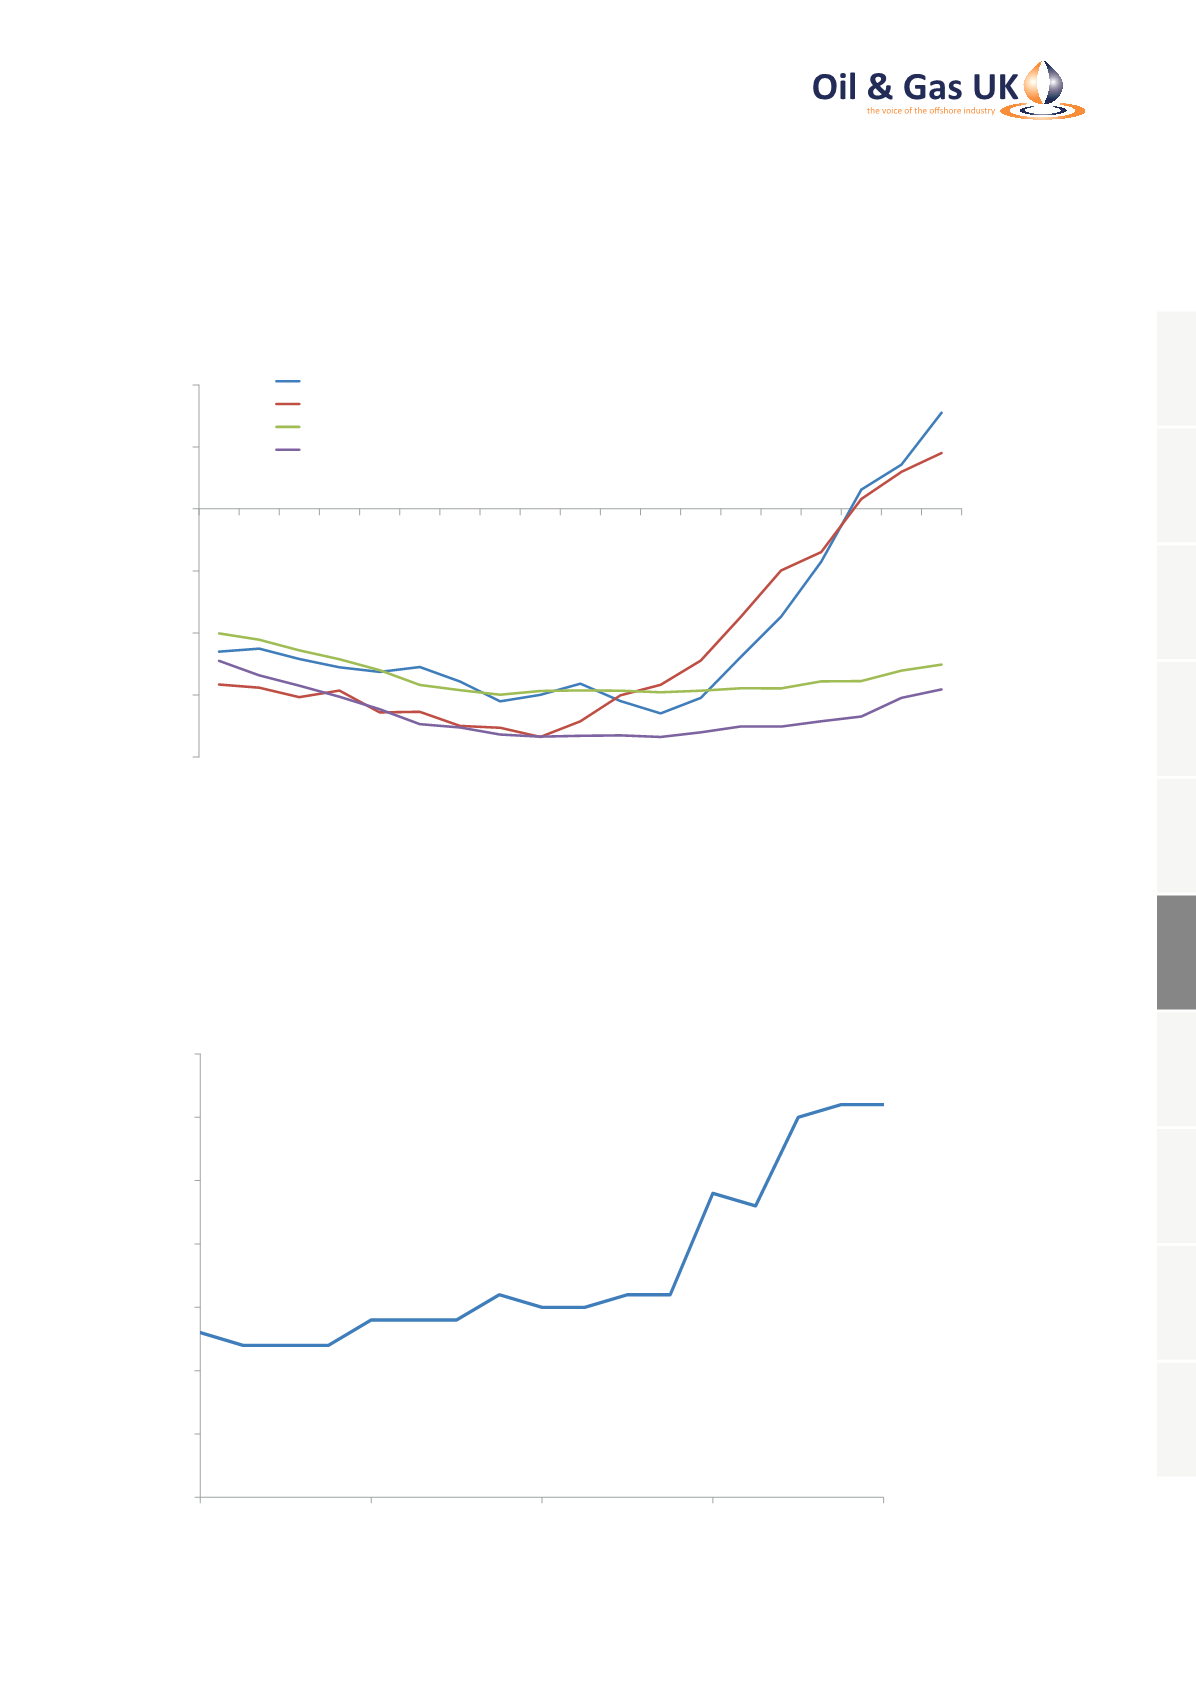
Average Number of 'High Quality' Applications per Job
Source: Oil and Gas Job Search
-40
-30
-20
-10
0
10
20
January 2014
February 2014
March 2014
April 2014
May 2014
June 2014
July 2014
August 2014
September 2014
October 2014
November 2014
December 2014
January 2015
February 2015
March 2015
April 2015
May 2015
June 2015
July 2015
Annual Monthly Change in Claimants Aged 16 to 64 (%)
Aberdeen City
Aberdeenshire
Yorkshire and the Humber
East of England
Source: nomis (ONS)
Figure 26: Unemployment Claimant Count
Figure 27: Number of ‘High Quality’ Applications per Oil and Gas Job
1
2
3
4
5
6
7
8
9
10