


 36 / 88

ECONOMIC REPORT 2015
36
6.3 Profitability
The ONS has measured the UKCS’ pre-tax rate of return
for many years. While rate of return is a recognised
accounting metric, it does have limitations when applied
to the oil and gas sector, not least because returns
are reported pre-tax. This ignores the substantial
and additional layers of tax uniquely imposed on
the industry (see Appendix B) and the subsequent
ineffective valuation of the depreciated capital base.
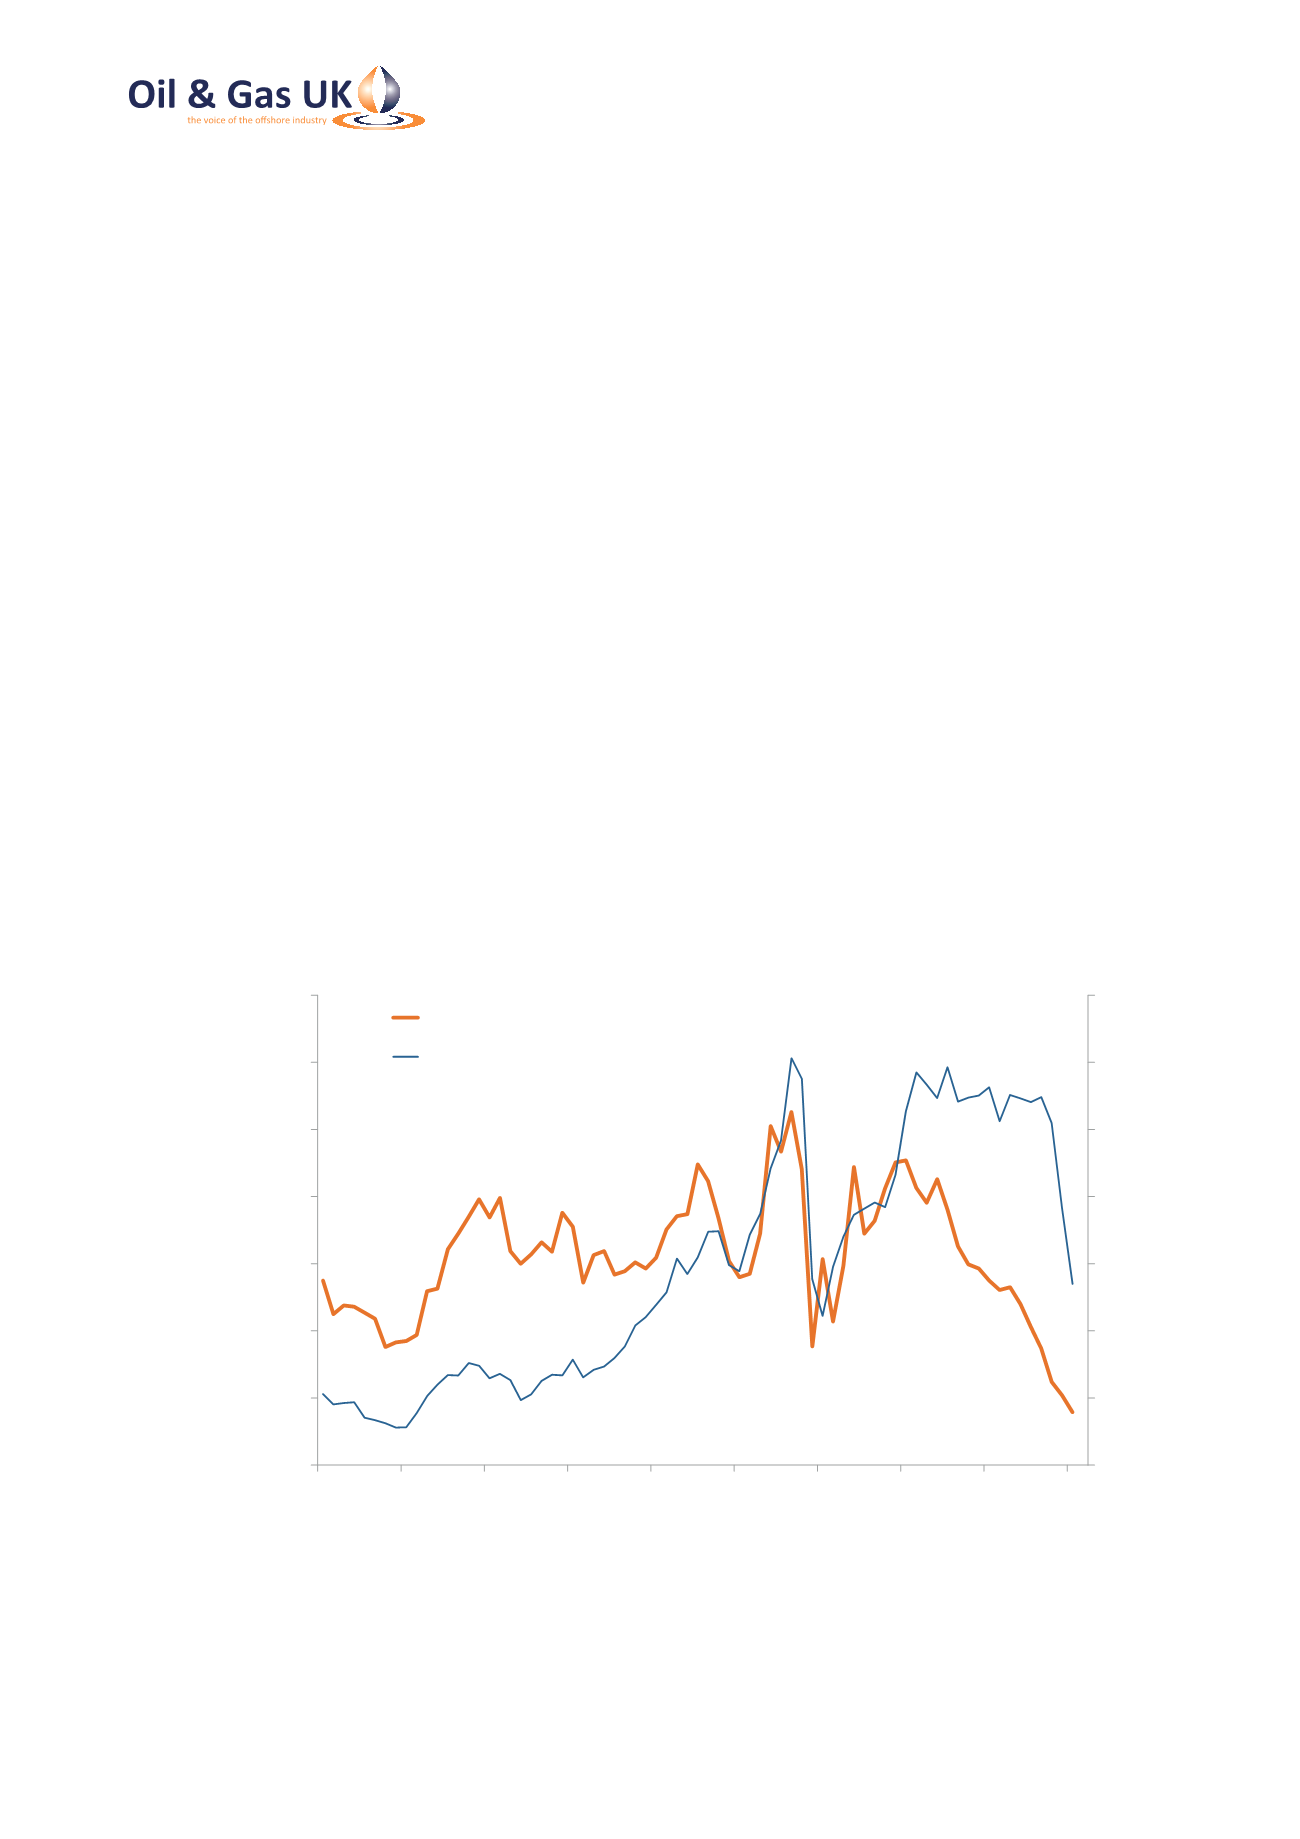
Notwithstanding the limitations of the measure,
Figure 20 shows the steady decline of the UKCS’
profitability since 2011, despite strong oil prices over
most of the period. The rate of return reached 7.9 per
cent in the first quarter of 2015, the latest period for
which data are available and the lowest since at least
1997
8
. The industry’s rate of return is now half what
it was during the last major downturn in the fourth
quarter of 2008, reflecting the fall in oil price coupled
with rising costs and record capital investment.
6.4 The UK Supply Chain
The home-grown oil and gas supply chain is
acknowledged to be a major industrial enterprise,
servicing the demands of the UKCS and developing a
strong international business founded on its domestic
success. As shown by Figure 22 opposite, turnover has
grown rapidly over the last five years, rising by almost
65 per cent over the period 2008 to 2013, equivalent
to a CAGR
of ten per cent per annum. The strongest
growth has been in the wells and the marine and
subsea sectors.
Exports of high technology goods and services to the
global energy market supplement domestic business
and contributed over £16 billion, or 42 per cent, of the
supply chain’s £39 billion total turnover in 2013
9
. The
supply chain also provides highly skilled employment in
support of the indigenous offshore oil and gas industry
and increasingly to service the international market.
0
20
40
60
80
100
120
140
0
10
20
30
40
50
60
70
1997 1999 2001 2003 2005 2007 2009 2011 2013 2015
Nominal Dated Brent ($/bbl)
Net Rate of Return (%)
Net Rate of Return (%)
Nominal Dated Brent ($/bbl)
Source: ONS, Argus Media
Figure 20: Office for National Statistics Published Net Rate of Return (Pre-Tax)
8
See
www.ons.gov.uk/ons/dcp171778_410201.pdf9
EY’s
Review of the UK Oilfield Services Industry
(March 2015) is available to download at
www.ey.com