


 16 / 36

14
AFRICAN FUSION
August 2017
Cover Story: UTP Maintenance
obtained with RECORD EST 625-1 LD
shows a slightly higher percentage of
Cr and Mo, resulting in a higher Pitting
Resistance Equivalent Number (PREN),
(54.5 versus 51.3). Important to note is
the difference in thickness between the
two deposits (3.6 mm against 5.0 mm)
which leads to a deposit saving of 28%
as strip consumption was 30.4 kg/m
2
compared with 42.2 kg/m
2
In the Fe <7% scenario, two layers
were necessary to achieve the desired Fe
content with the conventional solution,
resulting in almost double the welding
time. In terms of time to cover a surface,
only 1.6 h/m
2
was needed with the
new solution compared with 3.1 h/m
2
with the conventional one. Also in this
case, a higher PREN was reported (54.1
compared with 50.7). Because of the
smaller layer thickness, the saving on
depositedmetal obtainedwith RECORD
EST 625-1 LD is about 40%, with a strip
consumption of 40.5 kg/m
2
compared
with 70.9 kg/m
2
.
Corrosion tests
Corrosion tests results for the traditional
and new strip/flux combination are re-
viewed in Table 9, where corrosion rates
are reported. Results are fully satisfacto-
ry and meet the industry requirements.
Side bend tests
In the side bend tests, no cracks were
found with the cladding deposits re-
alised with RECORD EST 625-1 LD, both
in the as welded condition and after
severe PWHT at 670 °C for 24 hours,
showing soundness and integrity of the
weld overlay (Figures 4 and 5).
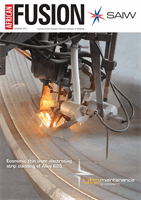
Through thickness analyses
To assess the homogeneity of weld de-
posits producedwith RECORDEST 625-1
LD with the Fe <7% target, a complete
chemical analysis survey frombasema-
terial to top surface of the cladding was
carried out. The chemical composition
was measured transversally through-
thickness in steps of 250 µm.
The through-thickness analysis
is shown in Figure 10 where the main
chemical elements in weight % are
reported from the fusion line to top sur-
face. As it can be expectedwith the ESSC
process, the chemical analysis is already
quite stable from250 µmfromthe fusion
line, resulting in more than 4.4 mm of
deposit with the desired chemistry (see
Figure 6).
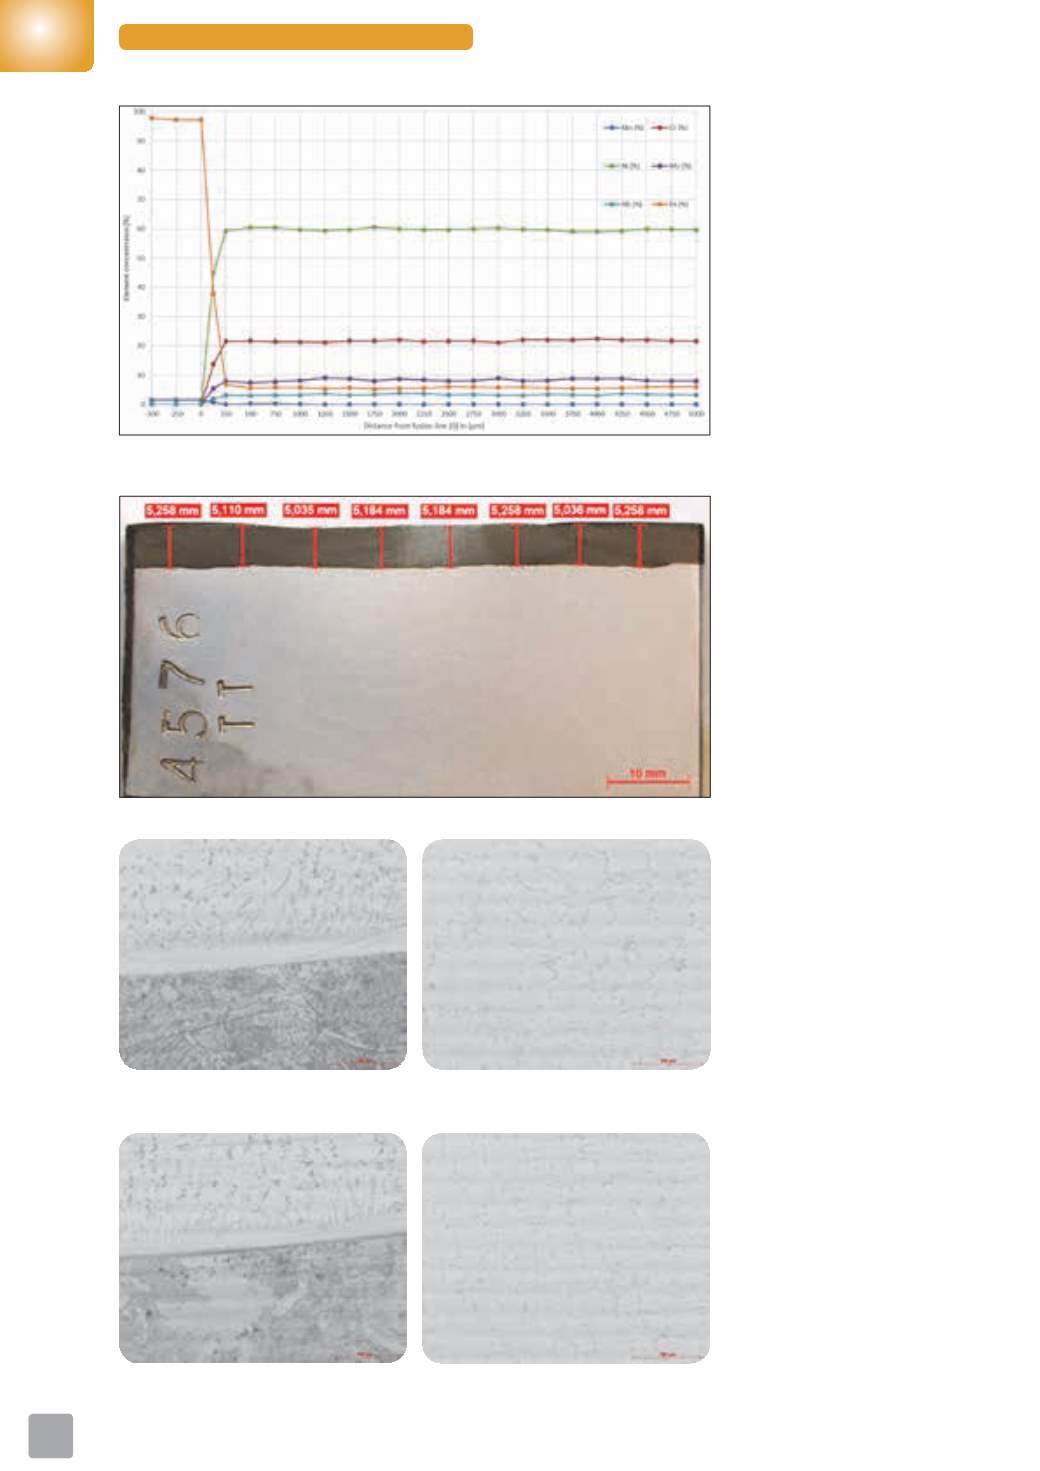
Macro and microscopic examination
Figure7 shows amacrographof thebead
profile. The fusion line is flat and free of
defects. The total thickness (including
Figure 6: Chemical analysis survey from base material to top surface of cladding with RECORD EST
625-1 LD, <7% Fe scenario.
Figure 7: Bead profile of cladding with RECORD EST 625-1 LD, with Fe < 7% scenario.
Figure 8: Micrographs. RECORD EST 625-1 LD cladding as welded. From left to right: fusion line area,
middle of the bead.
Figure 9: Micrographs. RECORD EST 625-1 LD cladding after PWHT at 670 0C for 24 hours. From left to
right: fusion line area, middle of the bead.