


 14 / 59

Self Storage
Performance Quarterly
Source: Cushman & Wakefield, Inc. The
Self Storage Performance Quarterly
, a publication of Cushman & Wakefield, Inc., is intended solely for use by paid subscribers.
Reproduction or distribution in whole or part without written permission is prohibited and subject to legal action. Copyright® 2017
Cushman & Wakefield | Valuation & Advisory
9
Demand
Methodology
– SSDS tracks the rental activity of 306,000
±
self-storage units found in approximately 516
self-storage facilities every 30-days. To measure the changes in demand, SSDS tracks several indicators
including: the Ratio of Move-Ins to Move-Outs, the Net Absorption of Units and the changes in total facility’s
Potential Gross Income.
Our findings are reported monthly to subscribers and are summarized in the following tables and graphs.
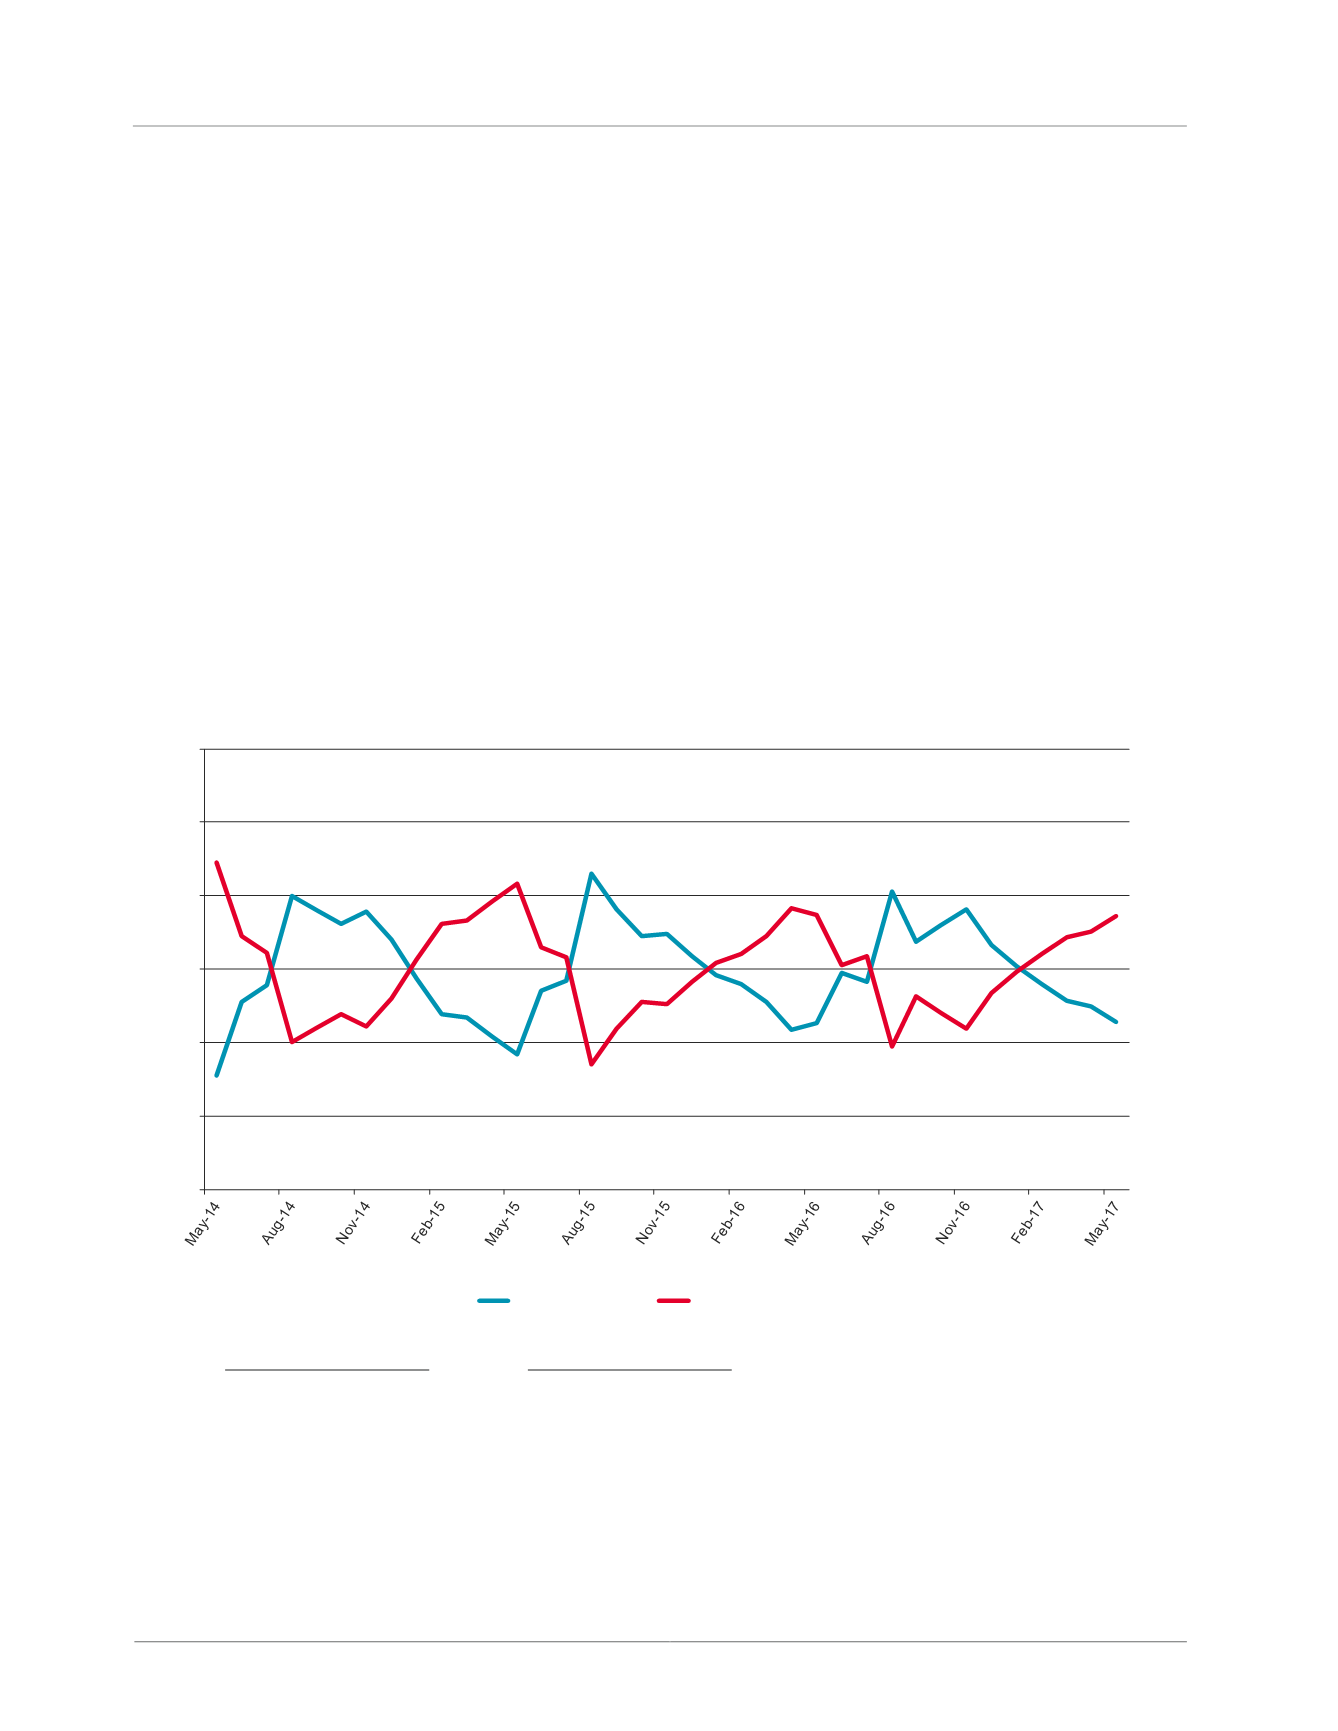
Ratio of Move-Ins : Move-Outs –
The red line in the graph below illustrates the trend in the ratio of tenants
moving into storage as opposed to those moving out of storage. At the peak of the season, typically in May
and June, the percentage of tenants moving into storage approaches 60% of the total rental activity.
Net Absorption Ratio
– Another measure of demand is to measure the net difference in the ratios of move-
ins to move-outs which is calculated as follows:
Move-ins
-
Move outs
= Net Absorption Ratio
Total Rental Activity
Total Rental Activity
Total Rental Activity is the sum of move-ins and move-outs in a given time period. When the ratio is positive it is
indicative of positive net absorption. The size of the Net Absorption Ratio reflects the gap or differential between
move-ins and move-outs.
35%
40%
45%
50%
55%
60%
65%
Demand Trend
Ratio of Move-Ins : Move Outs
(Same-Store Sample - 510
±
Facilities Nationwide)
Move-Outs
Move-Ins