


 18 / 59

Self Storage
Performance Quarterly
Source: Cushman & Wakefield, Inc. The
Self Storage Performance Quarterly
, a publication of Cushman & Wakefield, Inc., is intended solely for use by paid subscribers.
Reproduction or distribution in whole or part without written permission is prohibited and subject to legal action. Copyright® 2017
Cushman & Wakefield | Valuation & Advisory
13
Self Storage Performance Benchmarks
Concession Trends
The trends in the types of concessions being offered provide an indication of the direction the markets are
headed. SSDS tracks concessions in 45 different categories. Given the relative strength or weakness of any
given market, the type and number of facilities offering concessions will vary. The comparative cost of alternative
concession programs can be significant. For example:
The cost of a one-month free rent program can vary dramatically based on the duration of a tenant’s
occupancy, and on when, in the course of the tenancy, the “free” month is credited. Assuming a tenant’s
occupancy duration of six months, a one-month concession is a discount of 1/6th of the asking rental
rate. As the occupancy duration shortens, the effective cost of the discount increases.
Effective Cost
– SSDS calculates the effective cost of concessions by category and weights them by
prevalence. The result is an effective benchmark cost of concessions by market and in the aggregate, and should
not be confused with the actual cost of concessions in any given market place.
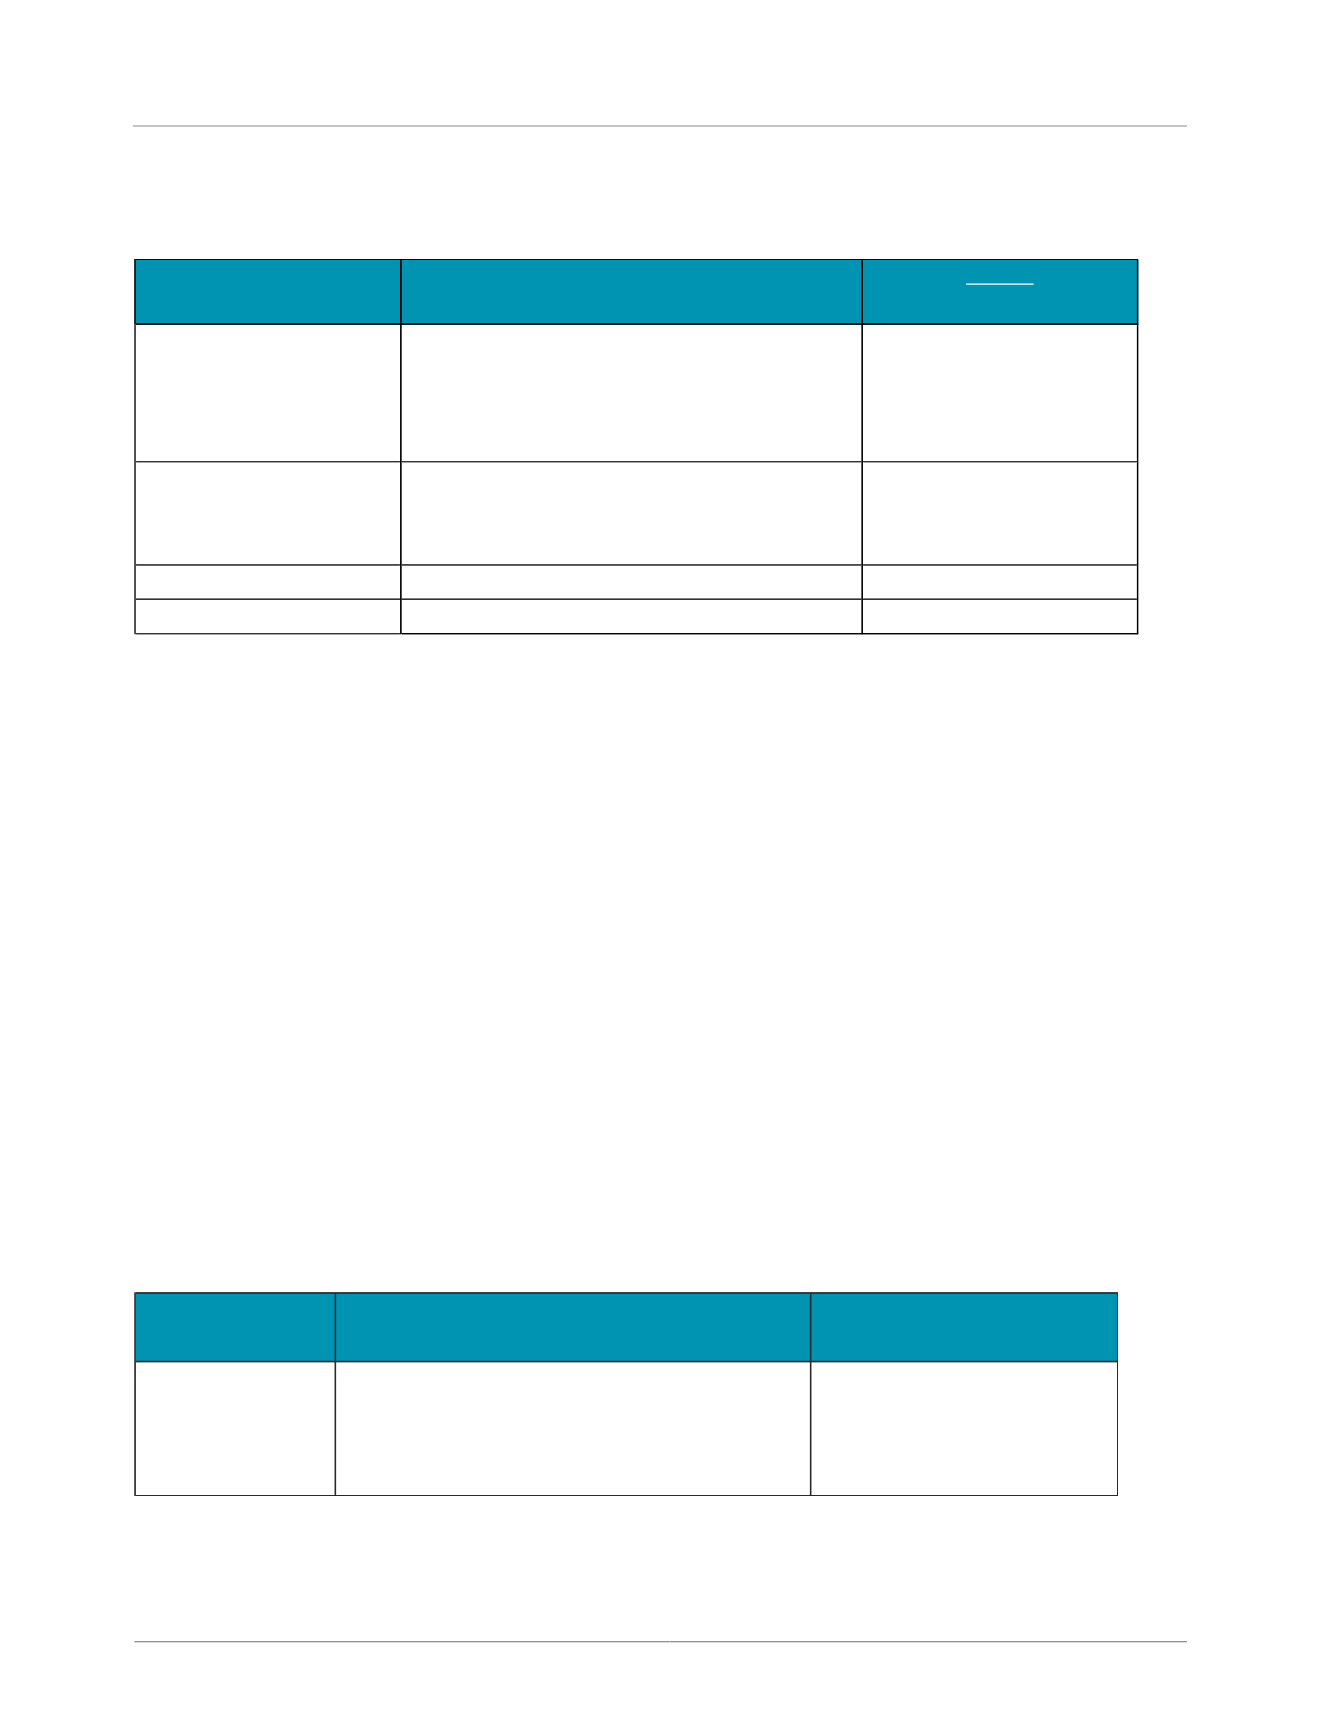
2Q16 3Q16 4Q16 1Q17 2Q17 Quarterly Seasonal Annual
Median Rental Rates
/Sq.Ft.Non-Climate-Controlled Units
Ground Level
1
$ 0.9900 $ 1.0000 $ 1.0000 $ 1.0000 $ 1.0300
3.0% 4.0% 1.0%
Upper Level
$ 1.2000 $ 1.2000 $ 1.2000 $ 1.2300 $ 1.3000
5.7% 8.3% 2.1%
Climate-Controlled Units
Ground Level
1
$ 1.3000 $ 1.3200 $ 1.3200 $ 1.3400 $ 1.3500
0.7% 3.8% 0.9%
Upper Level
$ 1.3900 $ 1.4000 $ 1.3500 $ 1.3600 $ 1.3995
2.9% 0.7% 0.2%
Median Occupancy
2
82.0% 81.0% 82.7% 86.5% 89.9% 3.4% 7.9% 2.0%
Rent Per Available
Sq.Ft.
$ 0.7370 $ 0.7385 $ 0.7581 $ 0.7894 $ 0.8552
8.3% 16.0% 3.9%
Change
1
The differential between ground- and upper-level rental rates is skewed by the disproportionate number of single-level facilities
in the population and sample of self-storage facilities. Facilities with upper-level units tend to be in higher density,
National Benchmarks
2
The aggregated median physical occupancy statistic is not meaningful by itself. Please refer to the detailed occupancy
statistics by submarket found in Table 3.
2Q16 3Q16 4Q16 1Q17 2Q17 Quarterly Seasonal Annual
Facilities Offering
Concessions
76.7% 74.2% 65.2% 70.3% 52.0% -18.3% -24.7% -6.2%
Concession Cost
Index.
114.5 109.5 105.5 115.8 108.4
-7.4
-6.1
-1.5
Absolute Change