


 15 / 59

Self Storage
Performance Quarterly
Source: Cushman & Wakefield, Inc. The
Self Storage Performance Quarterly
, a publication of Cushman & Wakefield, Inc., is intended solely for use by paid subscribers.
Reproduction or distribution in whole or part without written permission is prohibited and subject to legal action. Copyright® 2017
Cushman & Wakefield | Valuation & Advisory
10
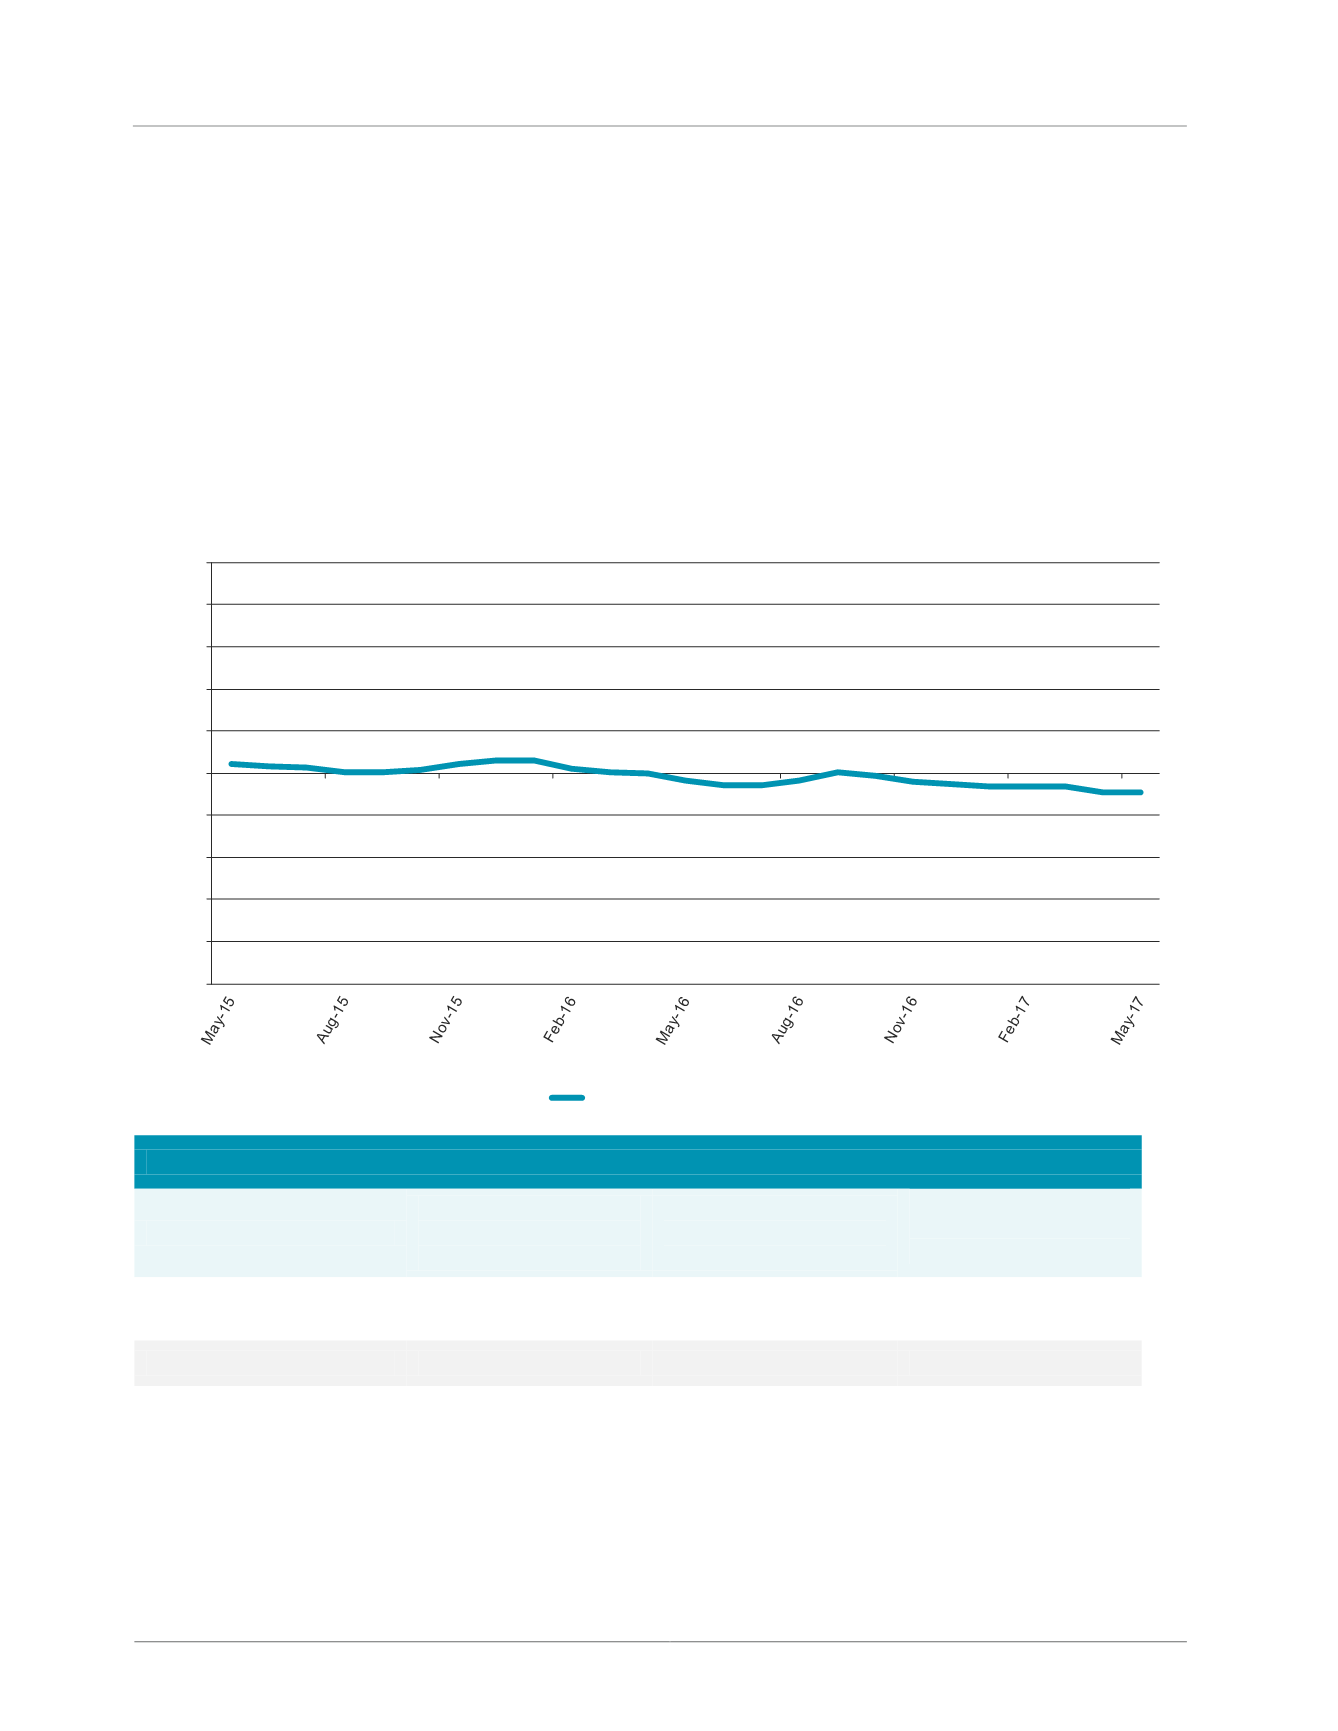
The graph below reflects the net difference in the ratio since May 2015. The trend line suggests that the ratio of
move-ins is returning to parity with move-outs. In layman’s terms, when the trend line is sloping upward, demand
is increasing and conversely, a downward sloping line would indicate weakening demand.
Storage Demand
– The following tables illustrate the trends in demand based upon 306,000± self-storage
units found in 516± facilities SSDS tracks every month.
Storage Demand – Nationwide
May 2017
vs.
April 2017
May 2017
vs.
May 2016
2Q17
vs.
2Q16
Total Rental Activity
6.6%
-6.8%
-4.4%
Move-Ins
8.5%
-6.9%
-5.4%
Move-Outs
4.6%
-6.6%
-3.4%
Source: Cushman & Wakefield, Inc.
-10%
-8%
-6%
-4%
-2%
0%
2%
4%
6%
8%
10%
Ratio of Move-Ins to Move-Outs
Net Difference in Ratio
1-Year Moving Average