


 32 / 59

Self Storage
Performance Quarterly
Source: Cushman & Wakefield, Inc. The
Self Storage Performance Quarterly
, a publication of Cushman & Wakefield, Inc., is intended solely for use by paid subscribers.
Reproduction or distribution in whole or part without written permission is prohibited and subject to legal action. Copyright® 2017
Cushman & Wakefield | Valuation & Advisory
27
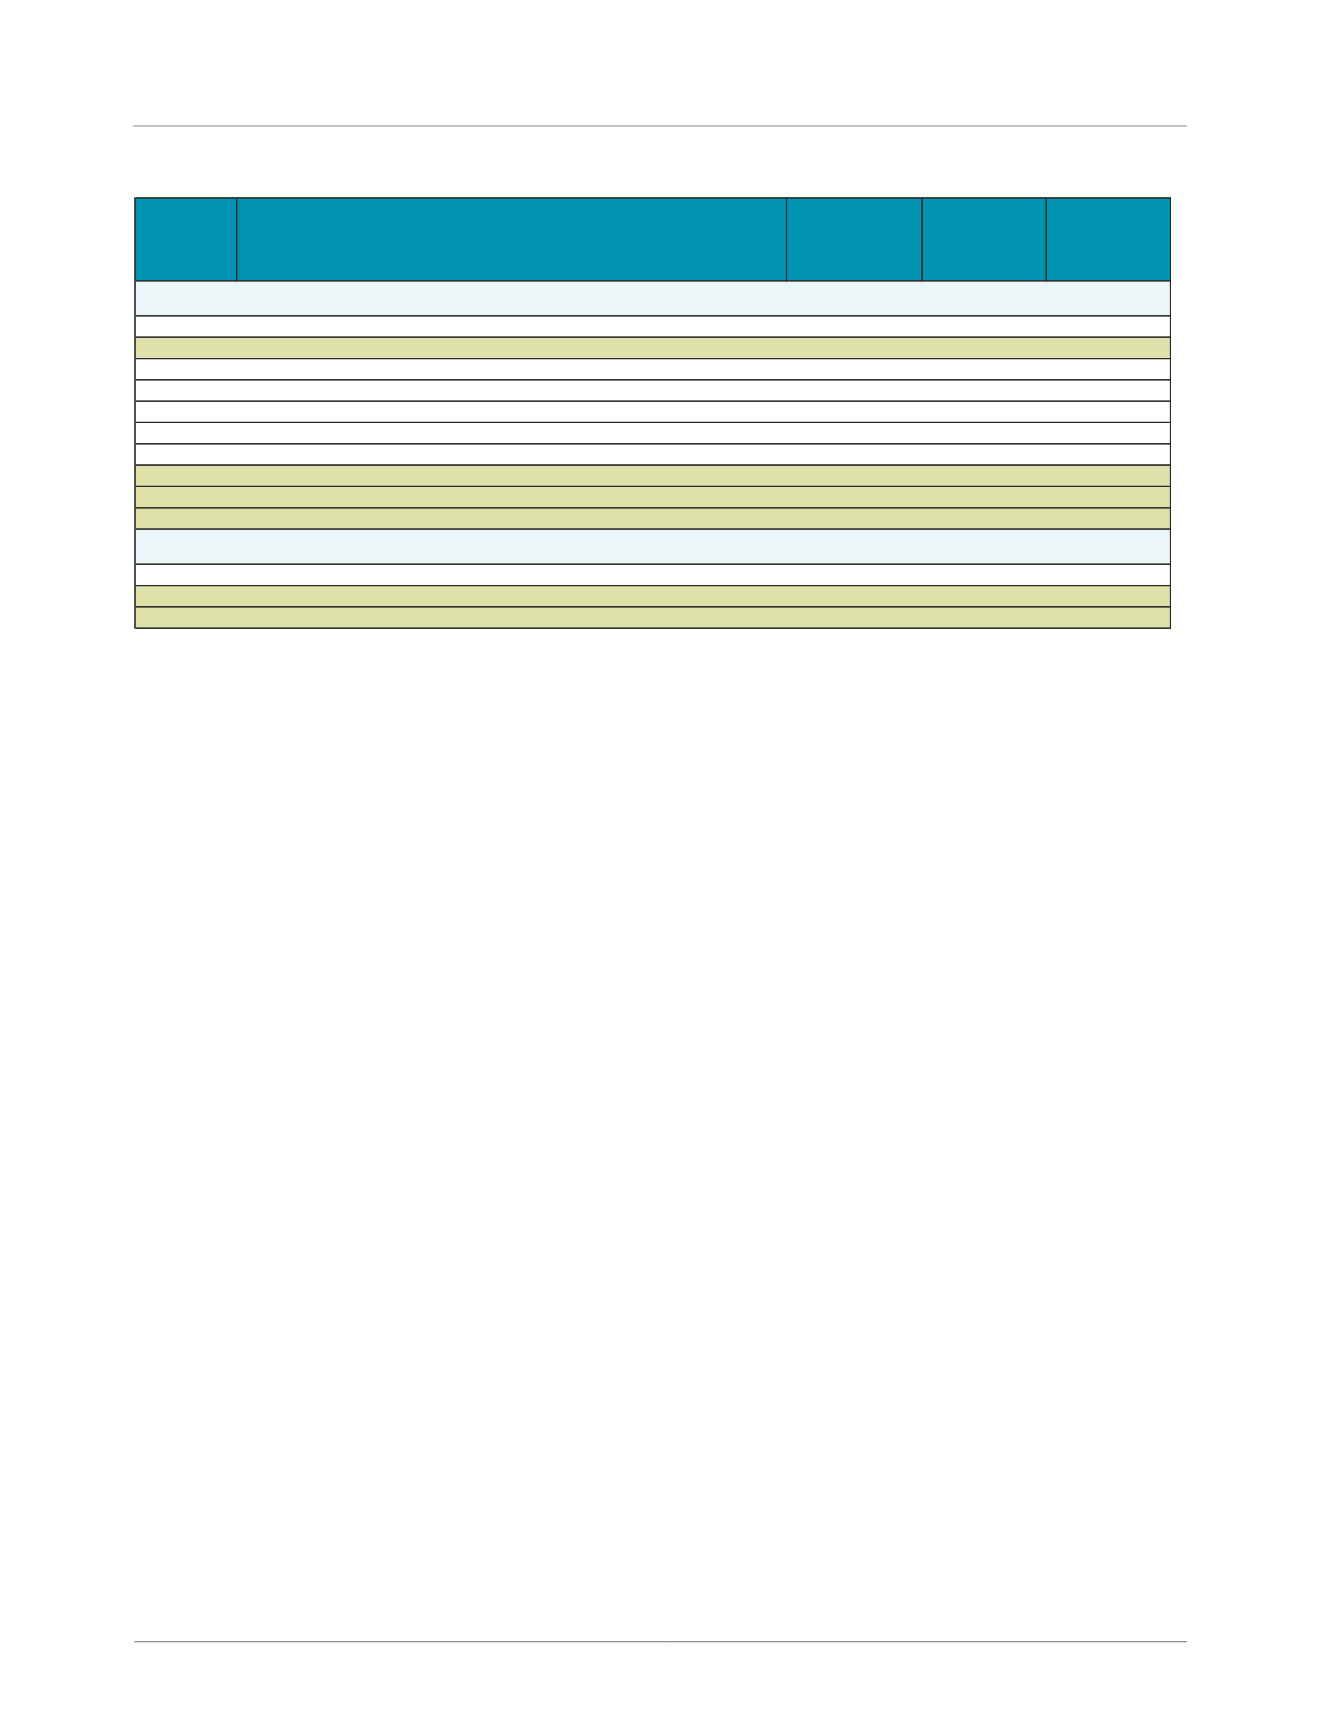
Note :
Light Tan shading denotes that MSA is split between NCREIF Regions and or Divisions.
Key
Seasonal Change in MSAs in Midwest Regions
Rental Rate
Change
Occupancy
Change
Change in
Rent Per
Avail. SF
CHI
Chicago-Naperville-Joliet, IL-IN-WI MSA
-5.3%
2.0%
0.0%
CIN
Cincinnati-Middletown, OH-KY-IN MSA
3.5%
-1.0%
2.1%
CLE
Cleveland-Elyria-Mentor, OH MSA
3.5%
1.0%
8.4%
COL
Columbus, OH MSA
1.9%
7.4%
18.9%
DET
Detroit-Warren-Livonia, MI MSA
8.2%
2.0%
11.0%
IND
Indianapolis, IN MSA
6.7%
12.0%
29.5%
MIL
Milwaukee-Waukesha-West Allis, WI MSA
2.2%
1.0%
10.3%
LOU
Louisville, KY-IN MSA
5.9%
-2.0%
8.8%
MIN
Minneapolis-St. Paul-Bloomington, MN-WI MSA
11.8%
14.0%
30.3%
STL
St. Louis, MO-IL MSA
6.7%
2.0%
11.2%
KAN
Kansas City, MO-KS MSA
0.0%
6.0%
10.0%
MIN
Minneapolis-St. Paul-Bloomington, MN-WI MSA
11.8%
14.0%
30.3%
STL
St. Louis, MO-IL MSA
6.7%
2.0%
11.2%
East North Cental Division
West North Cental Division