


 38 / 59

Self Storage
Performance Quarterly
Source: Cushman & Wakefield, Inc. The
Self Storage Performance Quarterly
, a publication of Cushman & Wakefield, Inc., is intended solely for use by paid subscribers.
Reproduction or distribution in whole or part without written permission is prohibited and subject to legal action. Copyright® 2017
Cushman & Wakefield | Valuation & Advisory
33
Note :
Light Tan shading denotes that MSA is split between NCREIF Regions and or Divisions.
Key
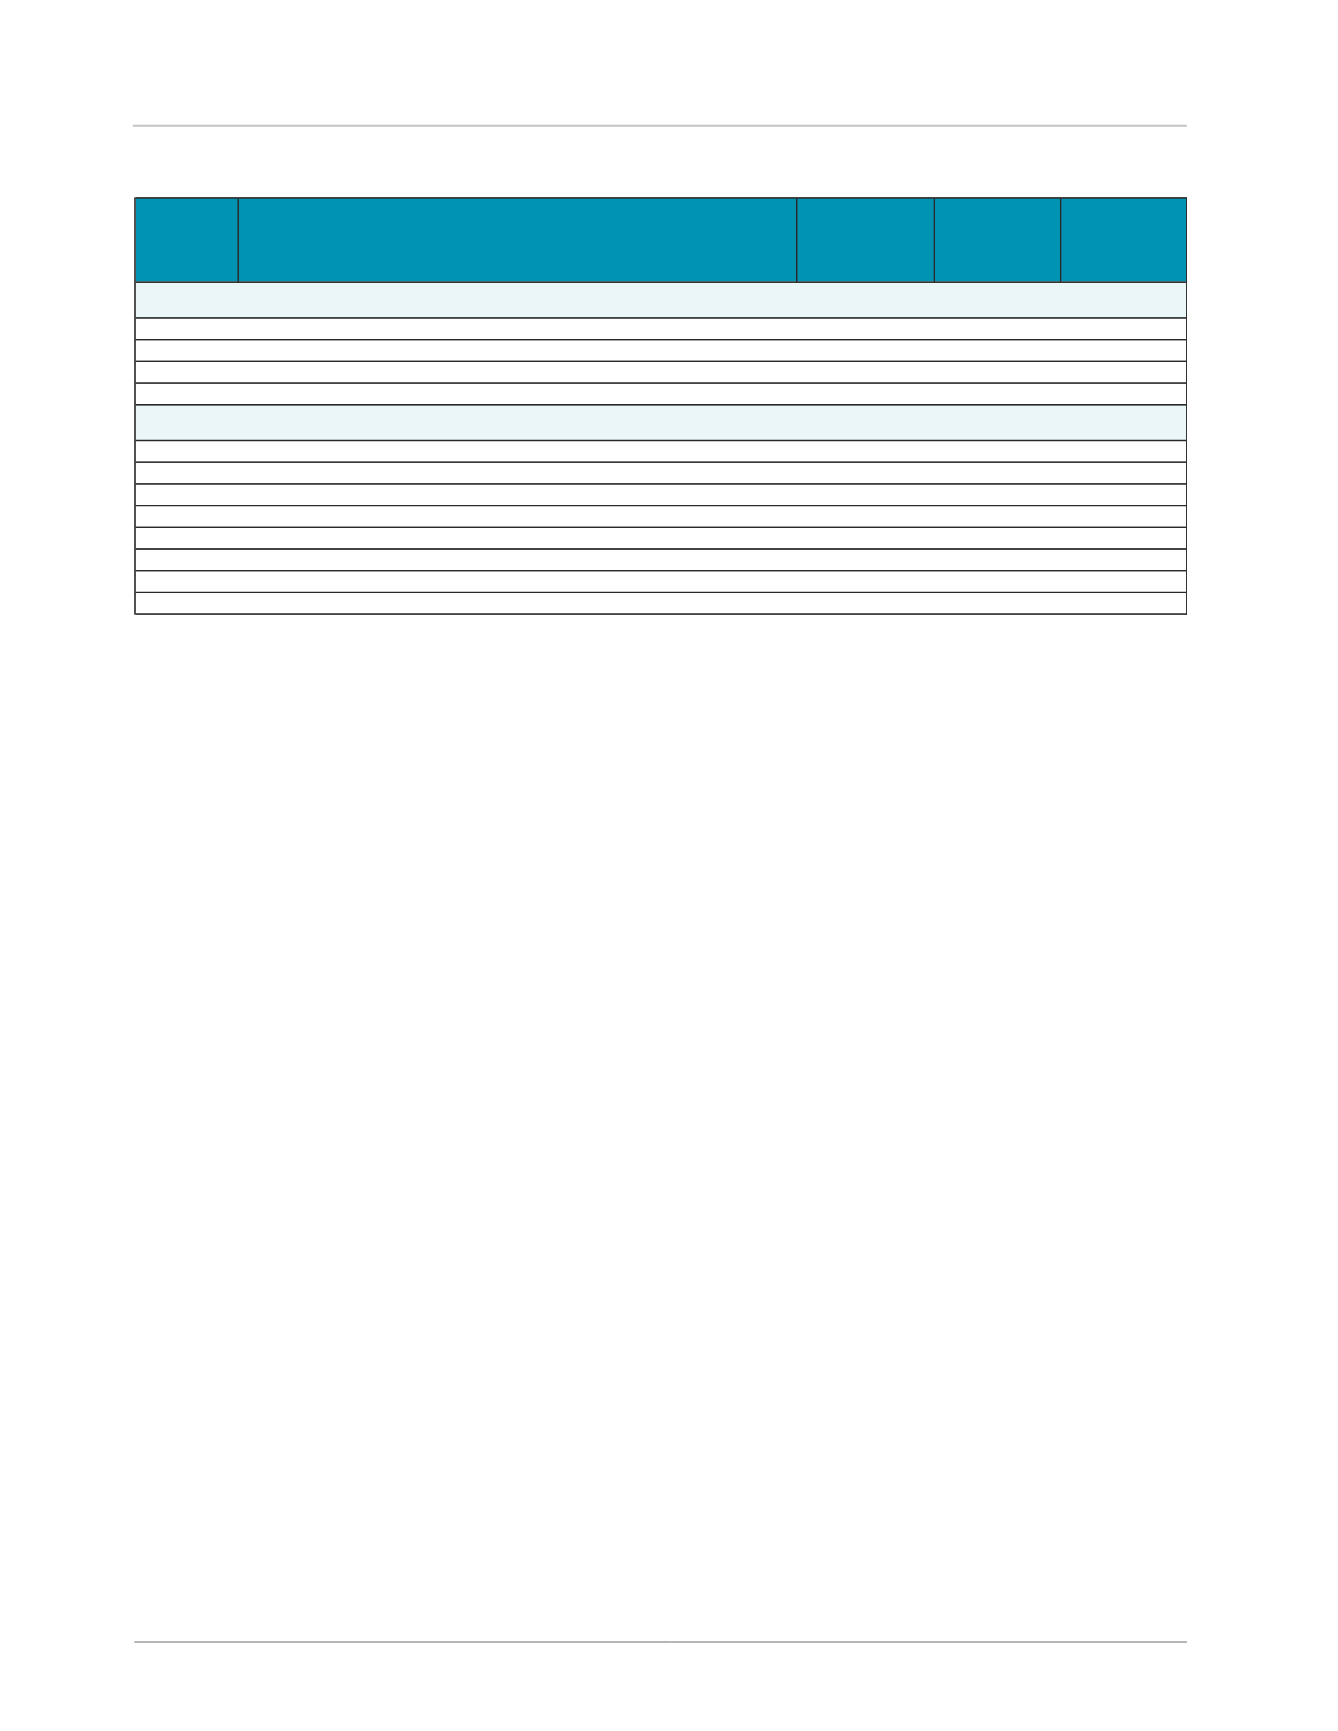
Seasonal Change in MSAs in West Regions
Rental Rate
Change
Occupancy
Change
Change in
Rent Per
Avail. SF
DEN
Denver-Aurora, CO MSA
3.9%
11.0%
18.4%
LVP
Las Vegas-Paradise, NV MSA
0.0%
7.9%
15.3%
PHO
Phoenix-Mesa-Scottsdale, AZ MSA
7.8%
3.3%
22.7%
SLC
Salt Lake City, UT MSA
10.0%
3.0%
9.7%
LAX
Los Angeles-Long Beach-Santa Ana, CA MSA
17.3%
12.8%
40.9%
POR
Portland-Vancouver-Beaverton, OR-WA MSA
20.8%
11.0%
33.9%
RIV
Riverside-San Bernardino-Ontario, CA MSA
10.0%
5.0%
22.1%
SAC
Sacramento-Arden-Arcade-Roseville, CA MSA
13.6%
14.4%
37.7%
SDC
San Diego-Carlsbad-San Marcos, CA MSA
7.4%
13.0%
25.0%
SFO
San Francisco-Oakland-Fremont, CA MSA
2.2%
10.0%
20.2%
SJS
San Jose-Sunnyvale-Santa Clara, CA MSA
-1.6%
3.1%
5.8%
SEA
Seattle-Tacoma-Bellevue, WA MSA
26.1%
14.2%
50.0%
Mountain Division
Pacific Division