


 17 / 56

 www.speechpathologyaustralia.org.au
JCPSLP
Volume 15, Number 1 2013
15
Additional measures of intervention effectiveness were
standardised measures of word and nonword reading
administered by the researcher prior to the intervention, and
by a speech pathologist unfamiliar with the children and
blind to research aims during the post-intervention baseline
sessions. These included the Test of Word Reading
Efficiency 2 (TOWRE 2; Torgesen et al., 2012) and the
Decoding subtests of the Phonological Awareness Test 2
(PhAT 2; Robertson & Salter, 2007).
Procedure
Each participant was involved in a total of 31 sessions of 15
to 20 minutes duration at their school. During the eight
pre- and eight post-baseline sessions (A1 and A2), the
Assessment NW List (referred to as
T Plate
) was
administered. The child touched the
Go
button on the iPad
and read out loud a nonword letter string. No feedback
about accuracy was given and responses were recorded
on a digital recorder for later analysis. This generated two
scores, nw rate and nw total, and provided data for the
starting level of each participant’s intervention phase.
During the 15 intervention sessions, the child began the
session with the T Plate and then completed the intervention
task. After touching
Go
the child read out loud a randomly
presented word or nonword, and was provided with verbal
feedback from the researcher, who touched the
Correct
button for accurate phonological recoding and blending, or
the
Help
button following inaccurate responses. The child
then put real words in the
Book
and nonwords in the
Bin
by
touching either graphic, and touched the
Go
button when
they were ready to start the next trial.
Three levels of help were provided for inaccurate
responses:
1. visual highlighting of each letter to prompt phonological
recoding,
2. visual highlighting with auditory cues of how to sound
out the word,
3. demonstration by the researcher of phonological
recoding and blending to read the real or nonword.
To strengthen MOR development, the verbal feedback
involved a scripted sentence for real words explaining
the meaning of the word, and for nonwords a sentence
explaining that it was not a word and thus had no meaning.
At the completion of the intervention task, the program
calculated percent correct responses.
The intervention involved three components: teaching (
L
plate
), practising (
P plate
), and consolidating the skills of
phonological recoding and blending to read letter strings
(
D plate
). The L plate was the starting point at all levels (2-,
3-, 4-letter strings, etc.) where the researcher modelled
and explained phonological recoding and blending. This
was followed by the P plate (where the child practised
phonological recoding and blending with a controlled set
of words) and finally by the D plate (full driver’s license).
The D plate used a PEST algorithm, based upon that
used by McArthur, Ellis, Atkinson, and Coltheart (2008) in
which the computer program responds to the accuracy
of the child’s response. As errors are made the program
presents increasingly easier letter strings (higher orthotactic
probability). If the child’s responses are accurate, the
program presents letters strings of increasing difficulty
(lower orthotactic probability). The child was required to
reach 90% accuracy to move on to the next level.
Results
This intervention was tailored to match the skills of each
participant. All participants began at 2-letter strings but
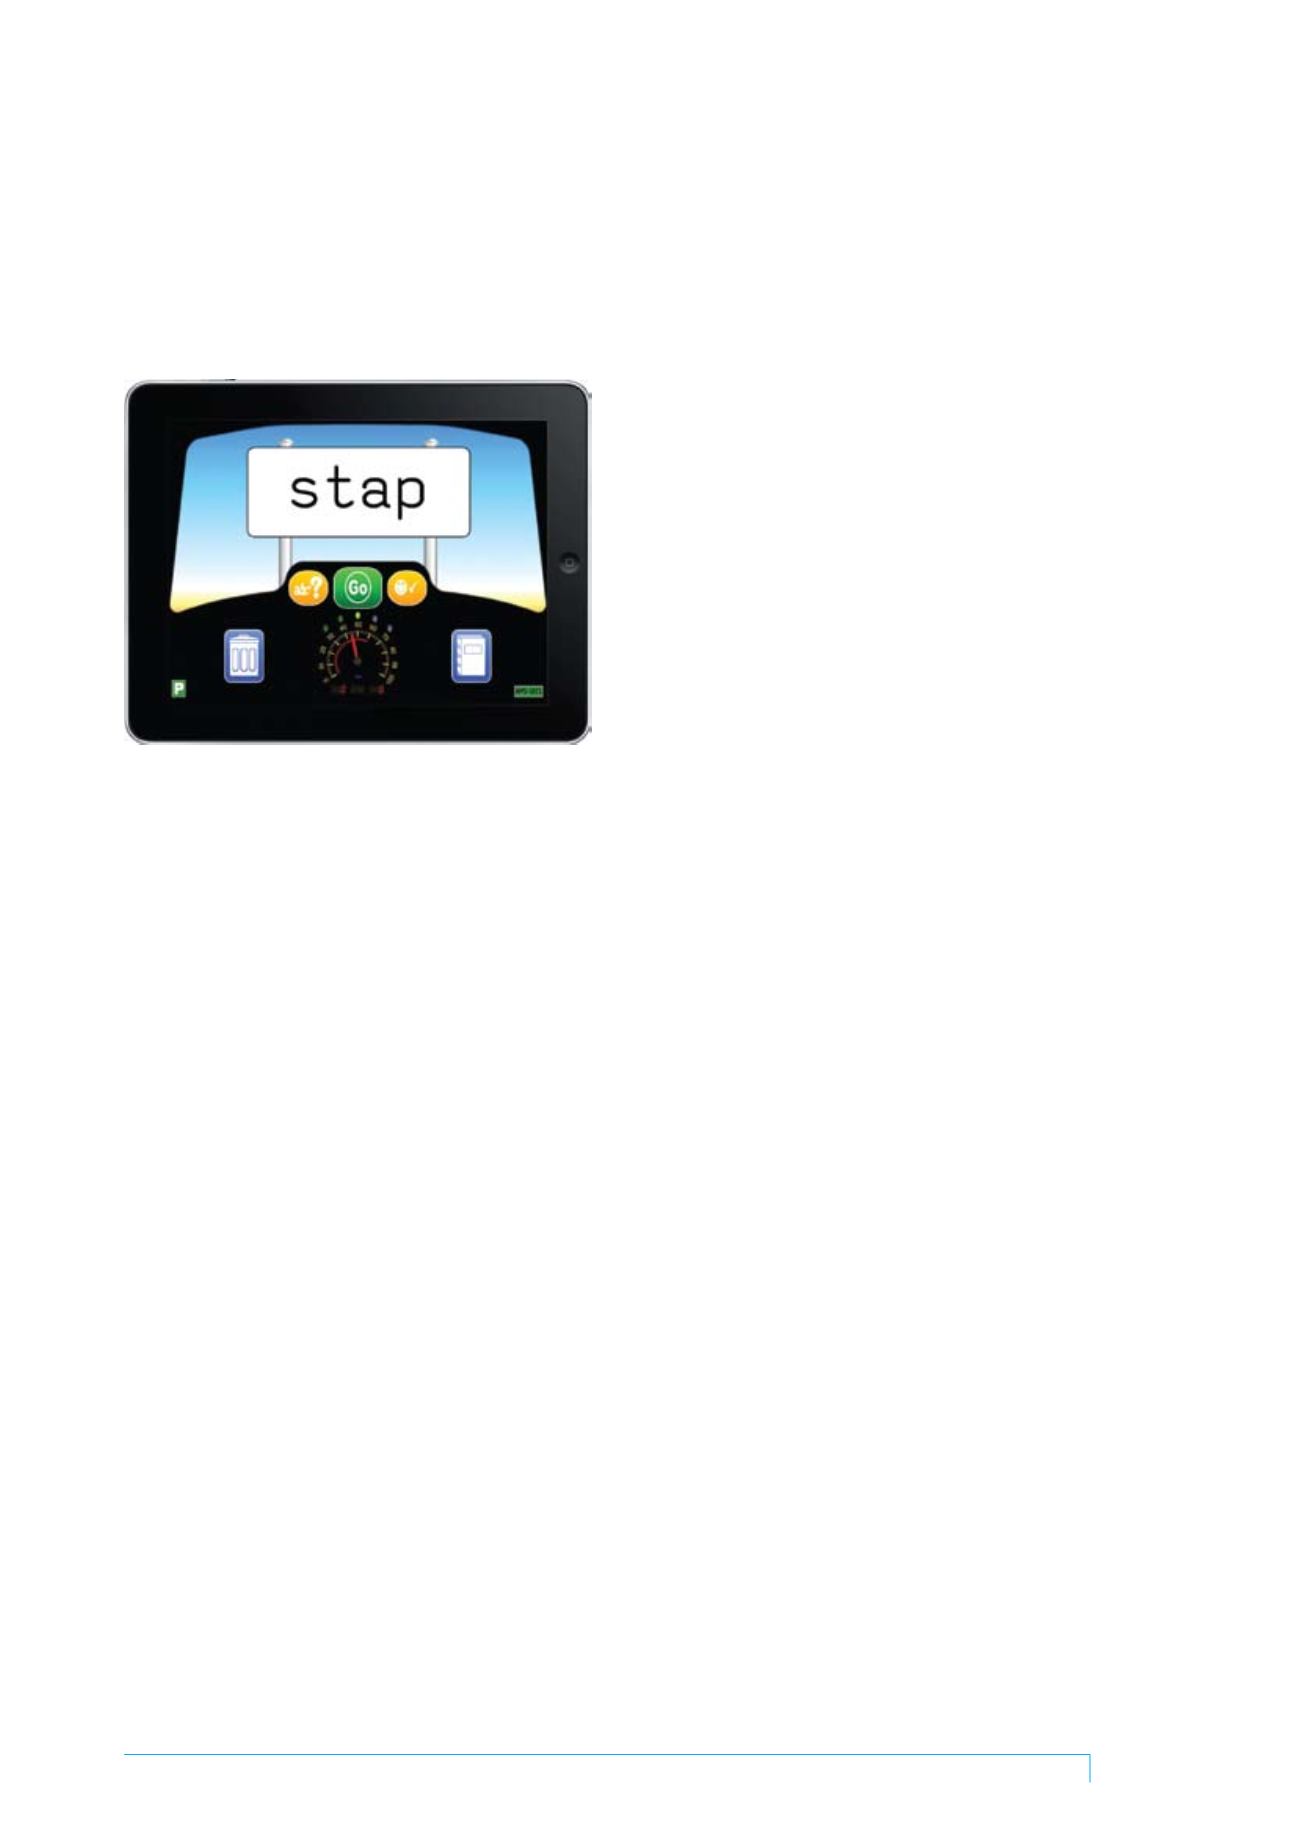
Design of the computer-supported
intervention materials
Two computer-supported programs were developed for this
research: the Assessment NW Lists, and the intervention
activity targeting accurate phonological recoding of words
and nonwords. Both were presented to all participants on
an iPad, using graphics relating to the metaphor of learning
to drive a car (Figure 1).
Figure 1. iPad screen graphic of intervention activity
The items were letter strings with 1:1 letter sound
correspondence, thus presenting letter strings of similar
type (Goswami et al., 2003). The Assessment NW Lists
used nonwords and the intervention activity, both words
and nonwords. The letter strings were presented with an
increasing level of difficulty, starting with 2-letter strings and
progressing through to 6-letter strings. Additionally, within
each level the letter strings were ordered from those with
high (easy) and progressing to those with low (harder)
orthotactic probability. Each of the Assessment NW Lists
required for the 31 sessions was constructed to be of equal
difficulty by use of a systematic allocation of nonwords
according to their orthotactic probability value. The MRC
Psycholinguistic Database (Coltheart, 1981) was the source
for the real words and the ARC Database (Rastle, Harrington,
& Coltheart, 2002) for the nonwords. The orthotactic
probability values of both words and nonwords were
calculated using the N-Watch method (Davis, 2005), which
enables users to obtain a broad range of statistics (e.g.,
word frequency, orthotactic and phonotactic probability).
An iPad was used to present the stimuli in a systematic
manner and record the child’s responses, but unlike many
other programs, the interactive role of the researcher was
central to provide reinforcement and feedback regarding
reading accuracy.
Measures
The primary measures of intervention effectiveness were
nonword reading rate (NW rate: the number of nonwords
read out loud in 1 minute) and the total number of
nonwords read correctly (NW total: the number correctly
read to a ceiling of 6 out of 8 errors), from 31 experimenter-
developed nonword lists each containing 70 letter strings
– the Assessment NW Lists. These measures were taken at
the beginning of every session (baseline and intervention).
Nonword reading measures the child’s ability to use
orthographic processing and phonological recoding to
decode unfamiliar words, and strongly predicts reading
development (Badian, 2001).