


 12 / 56

10
JCPSLP
Volume 15, Number 1 2013
Journal of Clinical Practice in Speech-Language Pathology
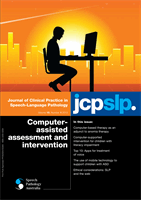
DSS per cent error rates
The MANOVA revealed significant differences among
groups on
personal pronoun
,
main verb
, and
sentence
point
, Wilks’
V
= .39,
F
(6,58) = 5.85,
p
< .001,
N
2
= .39. A
significant multivariate effect was found for time (pre-
intervention, post-intervention, 3 months post-intervention),
Wilks’
V
= .57,
F
(6,26) = 3.34,
p
= .005,
N
2
= .44. A
significant interaction for group X time was also found,
Wilks’
V
= .30,
F
(12,52) = 3.52,
p
< .001,
N
2
= .45.
Follow-up tests using ANOVAs on the dependent variables
point, each divided by number of utterances selected) at
pre-intervention, post-intervention, and 3 months post-
intervention.
A significant time X group multivariate effect was
predicted for each MANOVA, with the intervention groups
outperforming the control group. Planned follow-up tests
to the MANOVA were completed using mixed model
Analyses of variance (ANOVAs) tests with adjusted alphas
for each test (.05 divided by 2 =
p
< .025 for the DSS and
MLU ANOVAs; .05 divided by 3 =
p
<.017 for each DSS
grammatical category ANOVA). Post hoc analyses to the
ANOVAs, also with adjusted alpha levels, were completed
using univariate ANOVAs. These represented simple main
effect tests for DSS and MLU scores for each of the three
gain periods (
p
= .025 divided by 3,
p
<.008) and the DSS
grammatical categories at each of the three assessment
time-points (
p
= .017 divided by 3,
p
<.006). The adjusted
alpha levels represented a Bonferroni correction, controlling
for Type 1 error (Portney & Watkins, 2009).
Results
DSS and MLU gains
The MANOVA revealed significant differences among
groups on DSS and MLU change scores (dependent
variables), Wilks’
V
= .40,
F
(4,60) = 8.62,
p
< .001,
N
2
= .37.
A significant multivariate effect was found for time (3-month
gain1, 3-month gain2, and 6-month gain), Wilks’
V
= .32,
F
(4,28) = 15.07,
p
< .001,
N
2
= .68. A significant interaction
for group X time was also found, Wilks’
V
= .37,
F
(8,56) =
4.55,
p
< .001,
N
2
= .50. ANOVAs testing the dependent
variables, using the pre-set adjusted alpha levels (
p
< .025),
were conducted as follow-up tests. There was a significant
interaction effect for group X time for DSS,
F
(4,62) = 6.37,
p
< .001,
N
p
2
= .29, and MLU,
F
(4,62) = 3.26, p = .017,
N
p
2
=
.17, change scores.
Simple main effect tests were completed as a follow-up
to the significant interaction for each ANOVA. Findings for
DSS and MLU change met the set significance level (
p
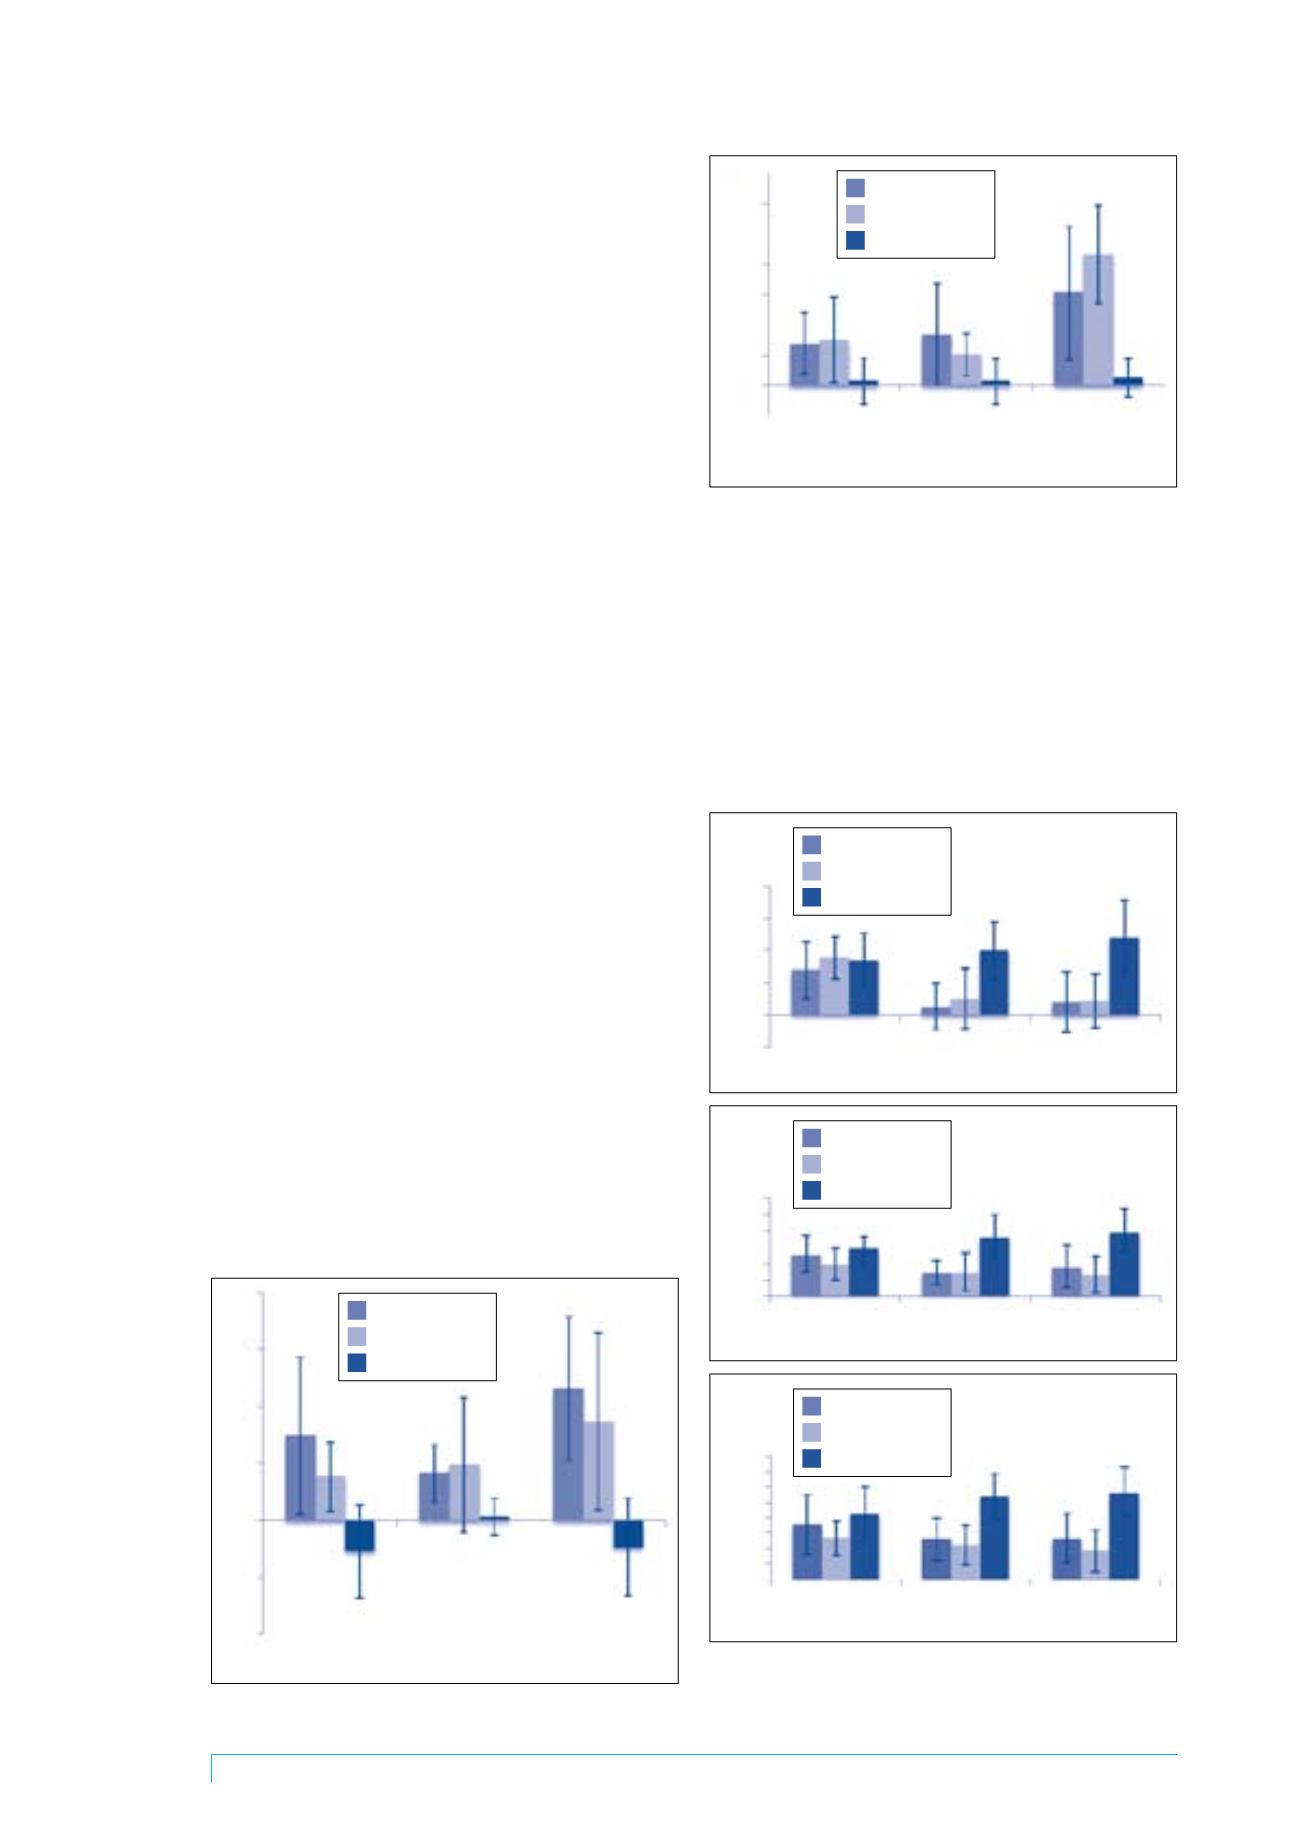
< .008) for follow-up tests for each gain period. Pairwise
comparisons of means revealed that computer-assisted
and table-top intervention resulted in significantly higher
DSS and MLU gains compared to controls. Only the two
intervention groups achieved DSS point gains at or above
0.76 for each gain period, demonstrating accelerated
growth. The two interventions did not differ statistically for
DSS or MLU (
p
> .05). See figures 1 and 2.
4
3
2
1
0
-1
-2
DSS point gains
Pre-post
(3-mth gain1)
Post-3 months
post (3-mth gain2)
Pre-3 months post
(6-mth gain)
Time points
computer-assisted
table-top
no-intervention
Figure 1. Mean DSS performance for each group
Note.
DSS = Developmental Sentence Scoring (Lee, 1974).
3.5
3
2.5
2
1.5
1
0.5
0
-0.5
MLU point gain
Pre-post
(3-mth gain1)
Post-3 months
post (3-mth gain2)
Pre-3 months post
(6-mth gain)
Time points
computer-assisted
table-top
no-intervention
Figure 2. Mean MLU performance for each group
Note.
MLU = Mean Length of Utterance (Brown, 1973; Miller, 1981).
20
15
10
5
0
-5
Per cent error rate
PP pre-intervention PP post-intervention PP 3-month post
Time points
computer-assisted
table-top
no-intervention
60
50
40
30
20
10
0
Per cent error rate
MV pre-intervention MV post-intervention MV 3-month post
Time points
computer-assisted
table-top
no-intervention
80
70
60
50
40
30
20
10
0
Per cent error rate
SP pre-intervention SP post-intervention SP 3-month post
Time points
computer-assisted
table-top
no-intervention
Figure 3. Mean per cent error rates for DSS grammatical
categories per group at each assessment time point
Note.
DSS = Developmental Sentence Scoring (Lee, 1974);
PP = personal pronoun; MV = main verb; SP = sentence point