


 15 / 120


BEMIP Gas Regional Investment Plan 2017 |
15
0
50
100
150
200
250
TWh/a
2017
2018
2019
2020
2021
2022
2025
2023
2024
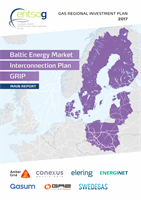
Demand forecast 2017 – 2025 (TWh/a) – Blue transition
Estonia
Sweden
Finland
Denmark
Latvia
Lithuania
Poland
Figure 2.2:
Demand forecast (TWh/a) in 2017–2025 – TYNDP Blue transition scenario
0
40
20
140
120
100
80
60
160
180
200
TWh/a
2017
2018
2019
2020
2021
2022
2025
2023
2024
Demand forecast 2017 – 2025 (TWh/a) – Green revolution
Estonia
Sweden
Finland
Denmark
Latvia
Lithuania
Poland
Figure 2.3:
Demand forecast (TWh/a) in 2017–2025 – TYNDP Green revolution scenario
0
50
100
150
200
250
TWh/a
2010
2011
2012
2013
2014
2015
2016
Natural gas demand history (TWh/a) 2010 – 2016
Estonia
Sweden
Finland
Denmark
Latvia
Lithuania
Poland
Figure 2.4:
Demand (TWh/a) in 2010–2016