


 24 / 120


24 |
BEMIP Gas Regional Investment Plan 2017
Moreover, the Danish Ministry of Finance has stated that Energinet.dk also must buy
the DONG offshore gas pipeline from the North Sea Platforms to Jutland (and the
corresponding oil pipeline in the North Sea). There is a still ongoing negotiation
taking place.
There are around 25 registered transport shippers in the Danish transmission
system including companies with primary business interest in the adjacent Swedish
gas system. Approximately, 20 supply companies offer gas on competitive terms to
smaller consumers with additional specialised suppliers catering to large-scale
industrial users.
Gas is traded bilaterally on Gas Transfer Facility (GTF) and multilaterally on the gas
exchange, Gaspoint Nordic (GPN). In 2016 the traded volume on GPN correspond-
ed to 68% of the Danish gas consumption.
Energinet.dk is working on ensuring the Danish (and Swedish) market as well
connected to the European market. The Danish gas market provides many options,
among others efficient transport of gas in and out of Germany and Sweden, custom-
er-oriented gas storage and a gas exchange offering secure and transparent trading.
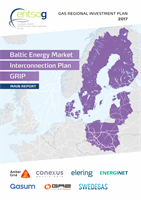
3.1.3 ENERGY MIX
Figure 3.1 shows the distribution on sources of the energy consumption in Denmark.
The energy mix is dominated by coal, oil and natural gas. Renewable energy
amounts to 29% of the energy consumption in 2015.
Figure 3.2 shows the subdivision of gas demand into sectors: households, power
and heat and other industry and transportation. Both historic and a projection for the
future is shown.
Oil
Renwable Energy
Coal
Natural gas
Waste
%
3
29
17
11
40
Figure 3.1:
Distribution on sources of total energy consumption in Denmark, 2015
0
5
4
3
2
1
Billion
Nm³
Growth of NGVs in the CEE region
Households
Other Industry and transportation
Power and heat (including CHP)
2005
2010
2015
Projections
Historical
2020
2025
Figure 3.2:
Development of overall gas consumption 2005–2025
subdivided into consumption sectors