


 28 / 120


28 |
BEMIP Gas Regional Investment Plan 2017
0
30
40
20
10
50
60
TWh/y
2011
2010
2012
2013
2014
2015
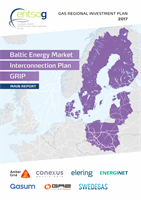
Historic average demand
Figure 3.6:
Historic demand in Denmark
The historic Danish demand is depicted in figure 3.6. The demand has decreased
since 2010 from about 50 to 30TWh/y in 2015.
The future demand in the Green and Blue TYNDP scenarios is shown in figures 3.7
and 3.8 respectively.
20
15
10
5
0
25
30
40
35
TWh/y
Green – Average demand
Blue– Average demand
Groningen production, realised and future, TWh
2016
2017
2018
2019
2020
2021
2022
2023
2024
2025
2026
2027
2028
2029
2030
2031
2032
2033
2034
2035
2036
2037
Figure 3.7:
Future Danish gas demand in Green and Blue scenario (TWh/y)
200
150
100
50
0
250
300
350
GWh/d
Green – daily peak demand
Blue – daily peak demand
Groningen production, realised and future, TWh
2016
2017
2018
2019
2020
2021
2022
2023
2024
2025
2026
2027
2028
2029
2030
2031
2032
2033
2034
2035
2036
2037
Figure 3.8:
Future Danish daily peak gas demand in Green and Blue scenario (GWh/d)