


 95 / 120

BEMIP Gas Regional Investment Plan 2017 |
95
5.1 ENTSOG TYNDP
Modelling Cases
In the TYNDP 2017 report ENTSOG performed several
models with different combinations of demand, supply
and infrastructure scenarios together with calculation of
several indicators. The analysis results can be found
from the ENTSOG TYNDP 2017 report and they are
not further analysed in this report.
The infrastructure scenarios in the TYNDP 2017 report are categorised as shown in
the Figure
5.1 below. The differences in the infrastructure scenarios between the
TYNDP 2017 modelled scenarios and BEMIP GRIP additional cases regarding the
infrastructure are only between the Low and Advanced infrastructure scenario in the
TYNDP 2017. The differences are listed in table 5.1.
This means that there is no additional value obtained from 2
nd
PCI list and High
scenarios of TYNDP 2017 modelling compared to the BEMIP GRIP analysis. Never-
theless, the TYNDP 2017 analysis included more indicators than included in this
BEMIP GRIP report.
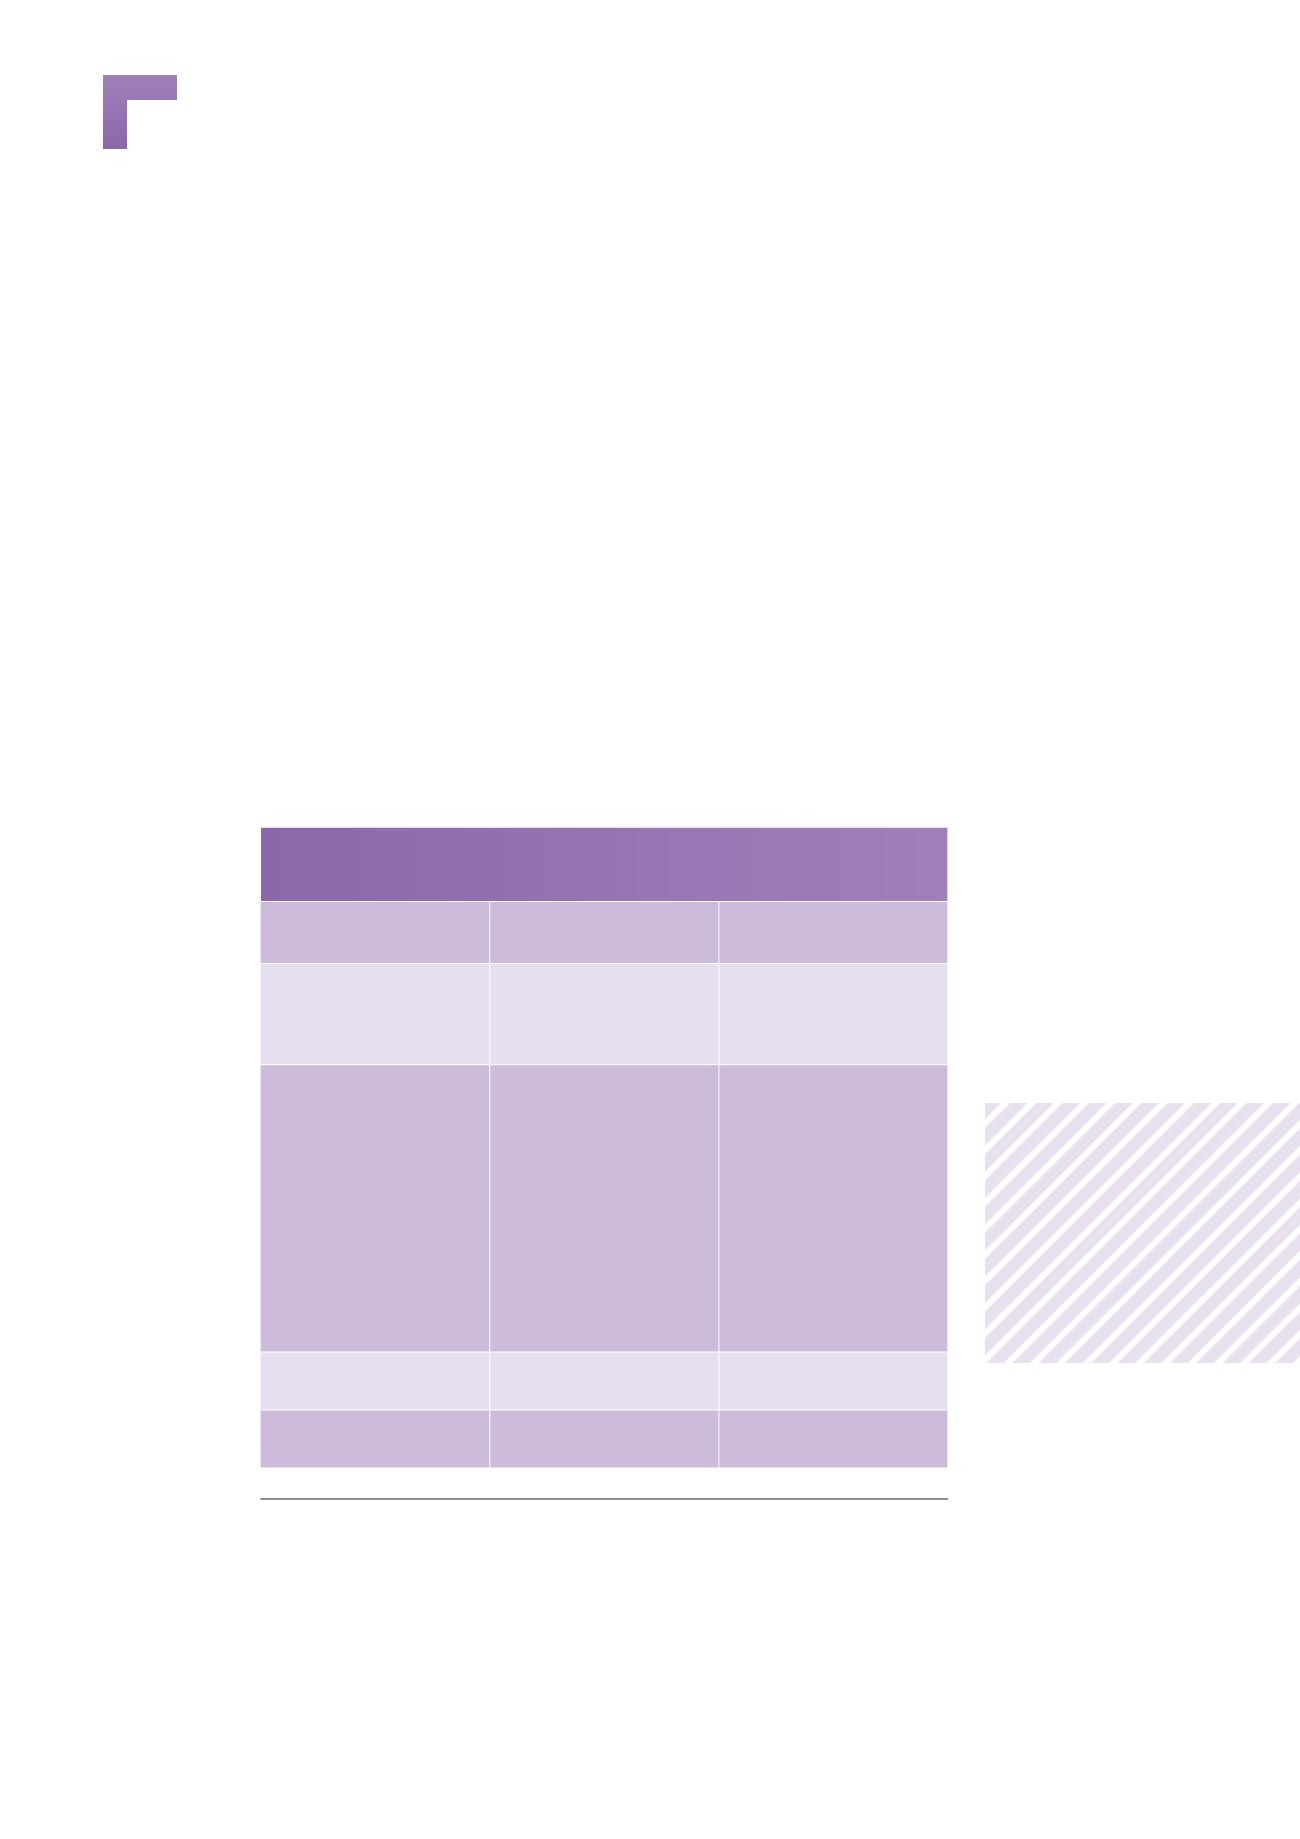
INFRASTRUCTURE DIFFERENCES BETWEEN TYNDP 2017
AND BEMIP GRIP MODELLINGS
TYNDP 2017
infrastructure scenario
BEMIP GRIP
infrastructure case
Difference
Low
Low + GIPL
Compared to TYNDP 2017,
BEMIP GRIP scenario
includes also:
– GIPL project
Advanced
Low including all PCIs in the
Baltic States (LT, LV, EE)
Compared to TYNDP 2017,
BEMIP GRIP scenario
includes also:
– Tallinn LNG
– Enhancement of Latvia-
Lithuania interconnection
– Upgrade of LNG terminal
in Świnoujście
– Baltic Pipe
– North–South Gas Corridor
in Eastern Poland projects
2
nd
PCI list
Low including all PCIs in the
BEMIP countries
No difference
High
High including all PCIs in
the region
No difference
Table 5.1:
Infrastructure differences between TYNDP 2017 and BEMIP GRIP modellings