


 11 / 60

page 11
3. Oil and Gas Markets
Oil Markets
Oil markets have firmly re-established their reputation for volatility since the middle of 2014. In January 2016,
Brent briefly touched $27/barrel (bbl), the lowest for 12 years, having traded at $110/bbl just 18 months before.
Over the entire year of 2015, the dated Brent price averaged $52.50/bbl, down from $99/bbl in 2014 and the
lowest nominal annual figure since 2004.
The decline in prices was most rapid in late 2014, as the cumulative impact of rising non-OPEC supply, especially
in the US, was exacerbated by OPEC’s decision in November 2014 not to cut output to rebalance the market.
For most of 2015, Brent prices traded in a range of $45-65/bbl and oil markets showed some signs of moving
awkwardly and gradually towards a precarious balance as demand growth picked up and non-OPEC supply growth
abated. However, in December 2015 and January 2016, the selling pressure suddenly resumed, as OPEC’s continued
inaction was reinforced by a slowdown in the Chinese economy and anticipation of a rise in 2016 of Iranian crude
oil exports as it emerges from sanctions.
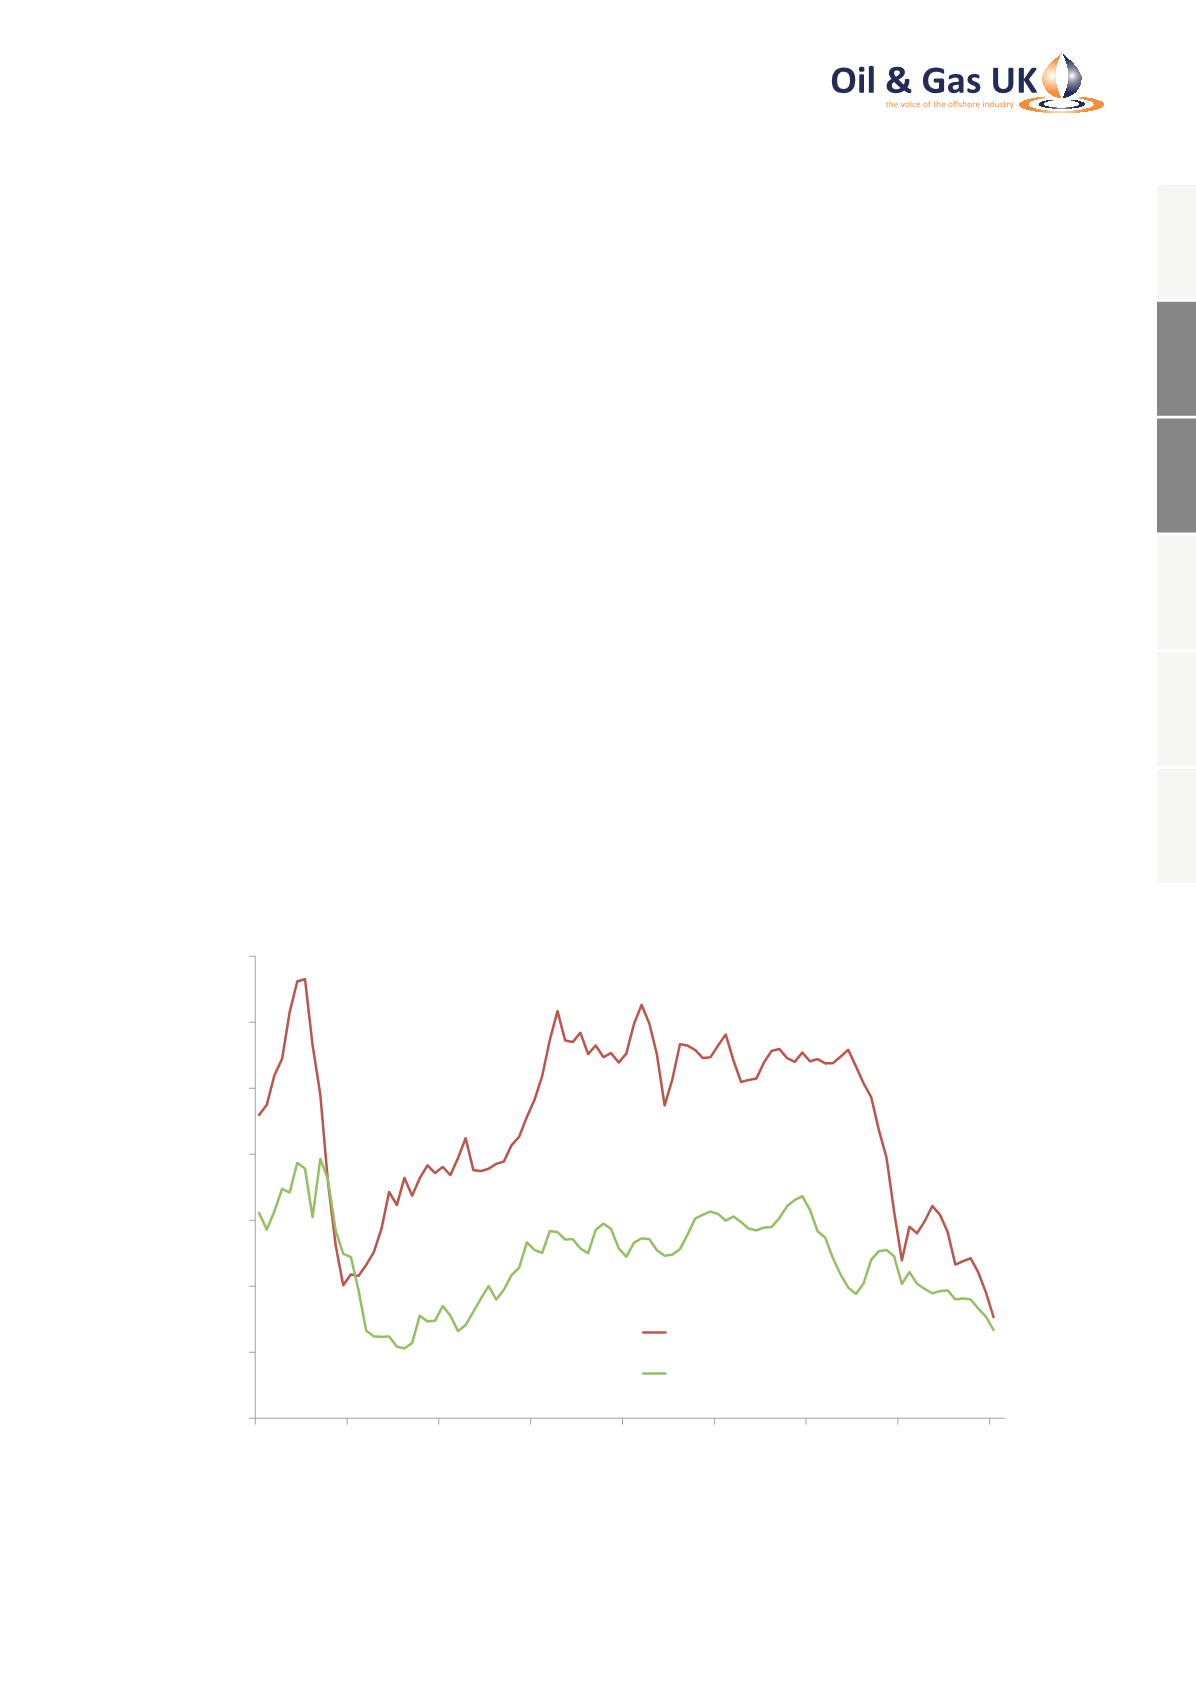
One of the most striking aspects of energy commodity price behaviour in 2015 was the re-convergence of spot
oil and hub gas prices, represented in Figure 1 by dated Brent and month ahead NBP. Together, these two market
benchmarks determine the value of UK Continental Shelf (UKCS) hydrocarbon production. In the latest cycle, gas
prices began to weaken in early 2014, before oil prices, but in 2015 NBP prices took their lead from the steady
erosion of oil prices, reinforced by the re-emergence of LNG over-supply.
Figure 1: Crude Oil and Natural Gas Prices Re-converged in 2015
0
20
40
60
80
100
120
140
2008
2009
2010
2011
2012
2013
2014
2015
2016
Nominal Price ($/boe)
Dated Brent
NBP Month Ahead
Source: Argus Media, ICIS Heren
1
2
3
4
5
6