


 13 / 60

page 13
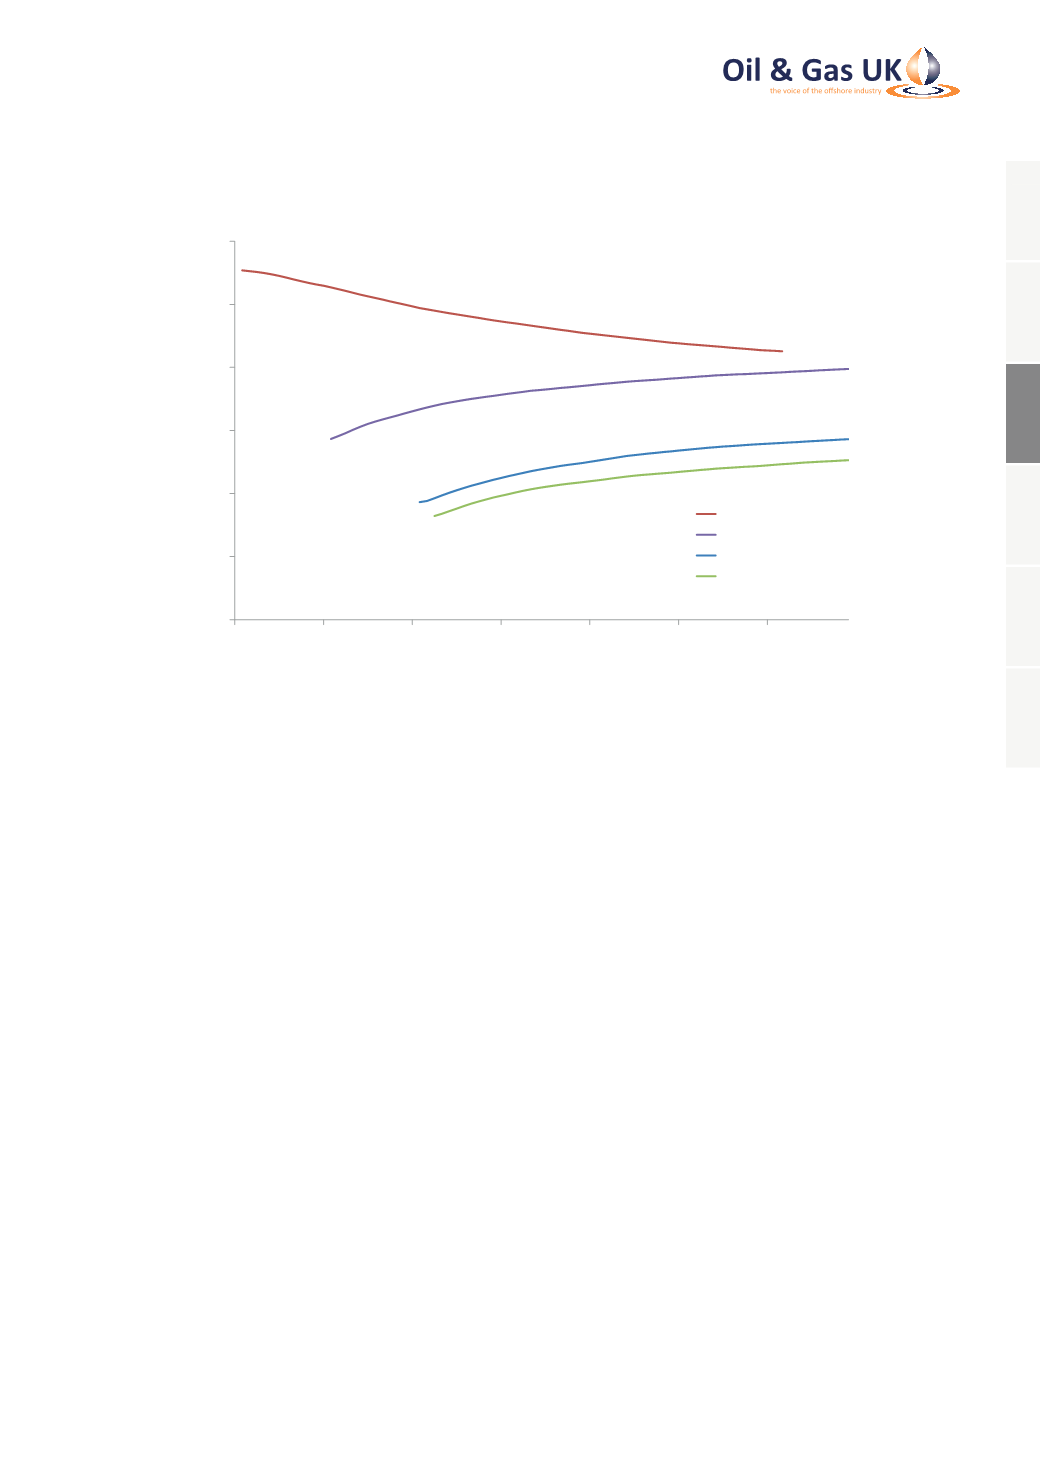
Figure 3: Brent Futures Curves Reflect Shift in Price Expectations
0
20
40
60
80
100
120
2014
2015
2016
2017
2018
2019
2020
Brent Futures ($/bbl)
End 2013
End 2014
End 2015
Feb 2016
Source: Intercontinental Exchange
The impact of the abrupt correction in oil and gas prices in 2014-16 on the UK upstream sector is difficult to
over-state. It may in future come to match that seen in the years immediately after the price collapse in 1986,
although the market circumstances are quite different today. The recent sharp contraction in operators’ cash flow
has prompted accelerated reduction of controllable costs, contract renegotiation, cuts in discretionary operating
and capital expenditure and, in some cases, a strategic review of operations. Brent (or more accurately Brent,
Forties, Oseberg and Ekofisk – BFOE) may be the benchmark used to price half the world’s internationally traded
oil but all North Sea producers are price-takers in a competitive global market; their only possible response is to
seek to cut their controllable costs in an effort to maintain their cash flow, profitability and competitive position.
Natural Gas
While oil prices are set in a global market, gas markets are still essentially regional in nature. Prices in the UK
NBP hub market, like those on the adjacent Dutch TTF hub market, declined in 2015, but much less dramatically
than those of oil. The annual average month ahead NBP price was 42.6 p/therm ($6.50/million British Thermal
Units (m BTU)), down only 17 per cent from 51.0 p/therm ($8.40/m BTU). Annual Brent prices, by contrast, fell
47 per cent in 2015. The revenue impact of lower prices in 2015 was therefore highly differentiated between oil
and gas producers on the UKCS. Even as oil prices dropped to 12-year lows in early 2016, prompt gas prices of
30 p/therm were still well above the range of 20-25 p/therm witnessed as recently as 2009-10.
1
2
3
4
5
6