


 15 / 60

page 15
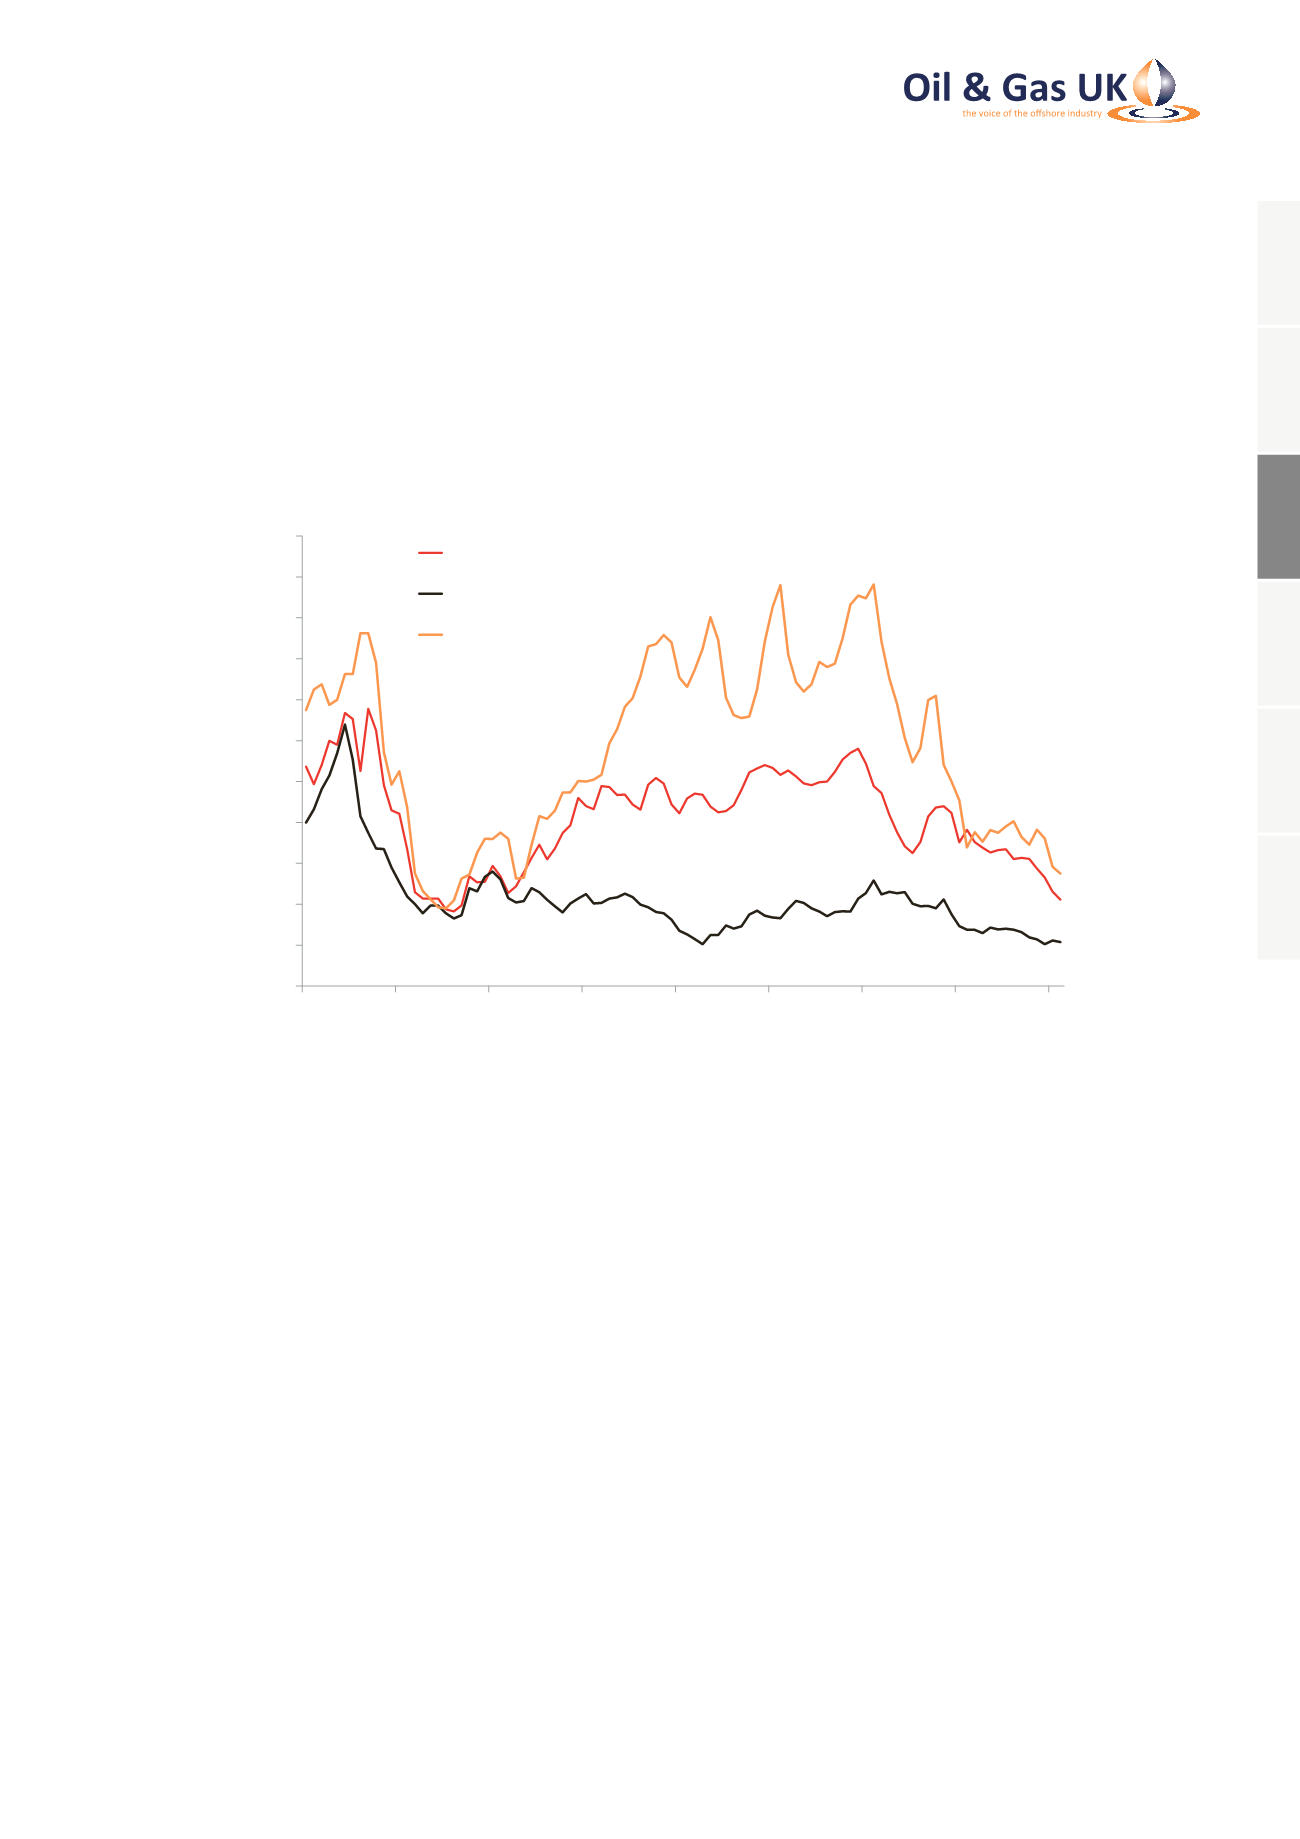
The first cargo of LNG to be exported from the US Gulf coast is due to be loaded inMarch 2016. Although investment
in US Gulf coast liquefaction capacity was contractually underpinned by demand for LNG in Asia, much of the LNG
will be capable of being delivered to Europe when Henry Hub-NBP price spreads are favourable. If US Henry Hub
prices remain in the range of $2-3/m BTU, US LNG may find itself competing in Europe with low-cost Russian
pipeline gas and Qatari LNG in Europe. Talk of a new ‘gas price war’ in Europe may be premature but there is little
doubt that any recovery in NBP and TTF gas prices may be capped by the growing supply-side competition in
European markets.
Figure 5: Regional Hub Gas and Spot LNG Prices
0
2
4
6
8
10
12
14
16
18
20
22
2008
2009
2010
2011
2012
2013
2014
2015
2016
Gas Price ($/Million BTU)
NBP Month Ahead
Henry Hub Front Month
Far East Spot LNG DES
Source: ICIS Heren, NYMEX
Carbon Prices
The EU Emissions Trading Scheme (EU ETS) remains the principal instrument of EU climate change policy and all
electricity generators and large industrial users of energy are required to participate in the cap-and-trade scheme.
Operators of most UKCS offshore installations and onshore terminals are included in the ETS and are consequently
obliged to buy allowances if they do not hold sufficient free allowances to cover their annual verified emissions
(14.8 million tonnes CO
2
in 2014).
Since the 2008-09 recession, which severely reduced EU energy demand, there has been a persistent
over-supply of allowances and prices have remained depressed. In 2015, prices of ETS allowances staged a
gradual recovery, reaching a three-year high of €8.50/te in November. However, they gave up most of these
gains in December 2015 and January 2016 as energy commodity prices collapsed, falling back below €6/te (see
Figure 6 overleaf).
1
2
3
4
5
6