


 27 / 60

page 27
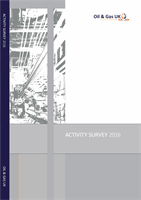
Figure 14: Changes in Unsanctioned Reserves
0.0
0.5
1.0
1.5
2.0
2.5
3.0
3.5
4.0
Possible andProbable2015
Difference in Reserves from Exisiting Possible and ProbableProjects
Decrease inReserves from Lossof Possible andProbableProjects
Increase in Reserves from NewPossible andProbableProjects
Possible andProbable2016
Reserves (Billion boe)
2015
2016
Source: Oil & Gas UK
Possible
and
Probable
at
01.01.2015
Possible
and
Probable
at
01.01.2016
Loss of Projects
-1.48
0.45
New Projects
Net Change in
Reserves from
Existing Projects
-0.07
3.69 billion
boe
2.59 billion
boe
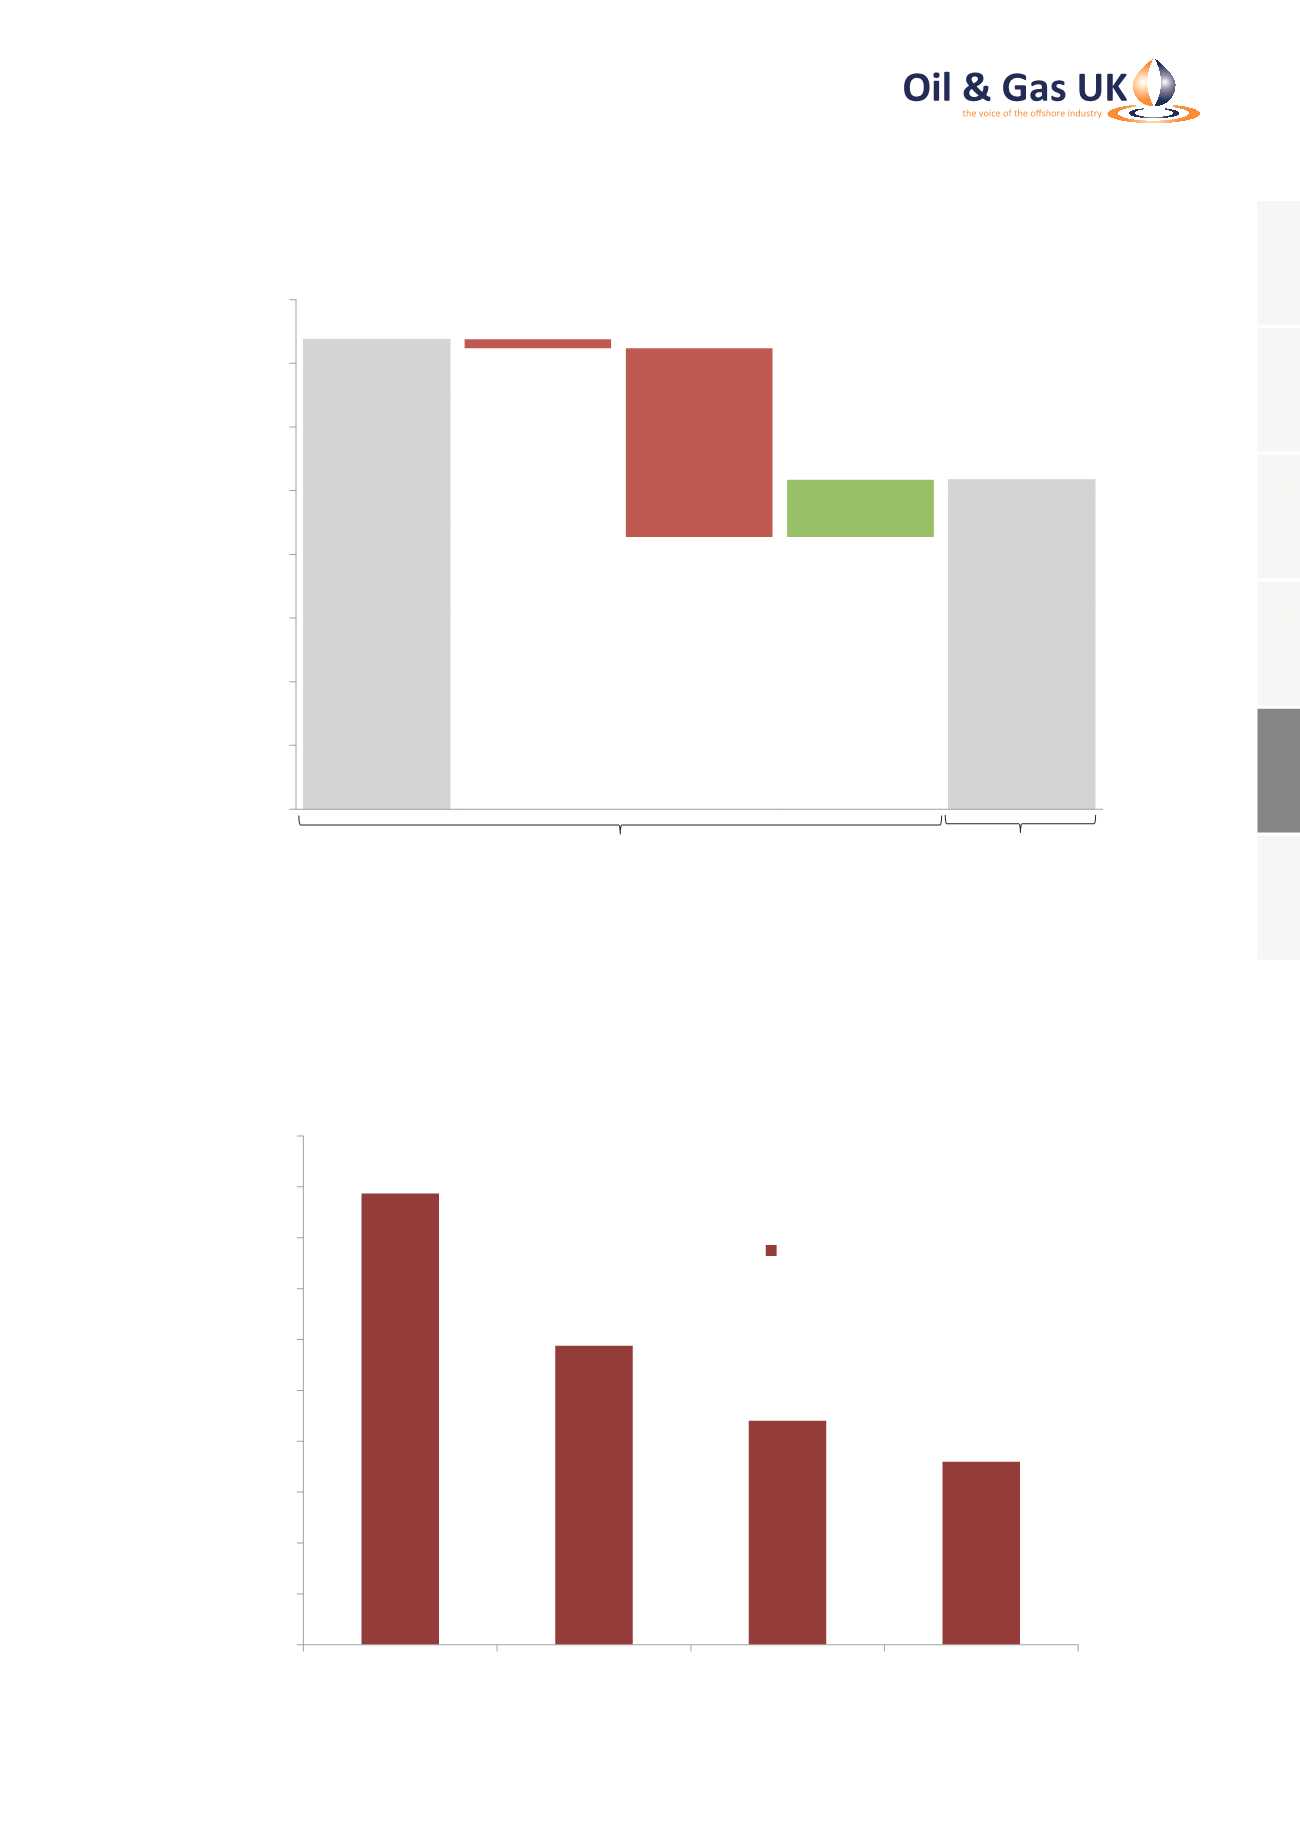
Figure 15: Price Sensitivity of Reserves Removed From Company Plans Over the Last 12 Months
0%
5%
10%
15%
20%
25%
30%
35%
40%
45%
50%
$100/bbl and 60 p/th $80/bbl and 48 p/th $60/bbl and 36 p/th $40/bbl and 24 p/th
Percentage of Removed Reserves
Potentially Commercially Viable
Source: Oil & Gas UK
1
2
3
4
5
6