


 50 / 60

ACTIVITY SURVEY
2016
page 50
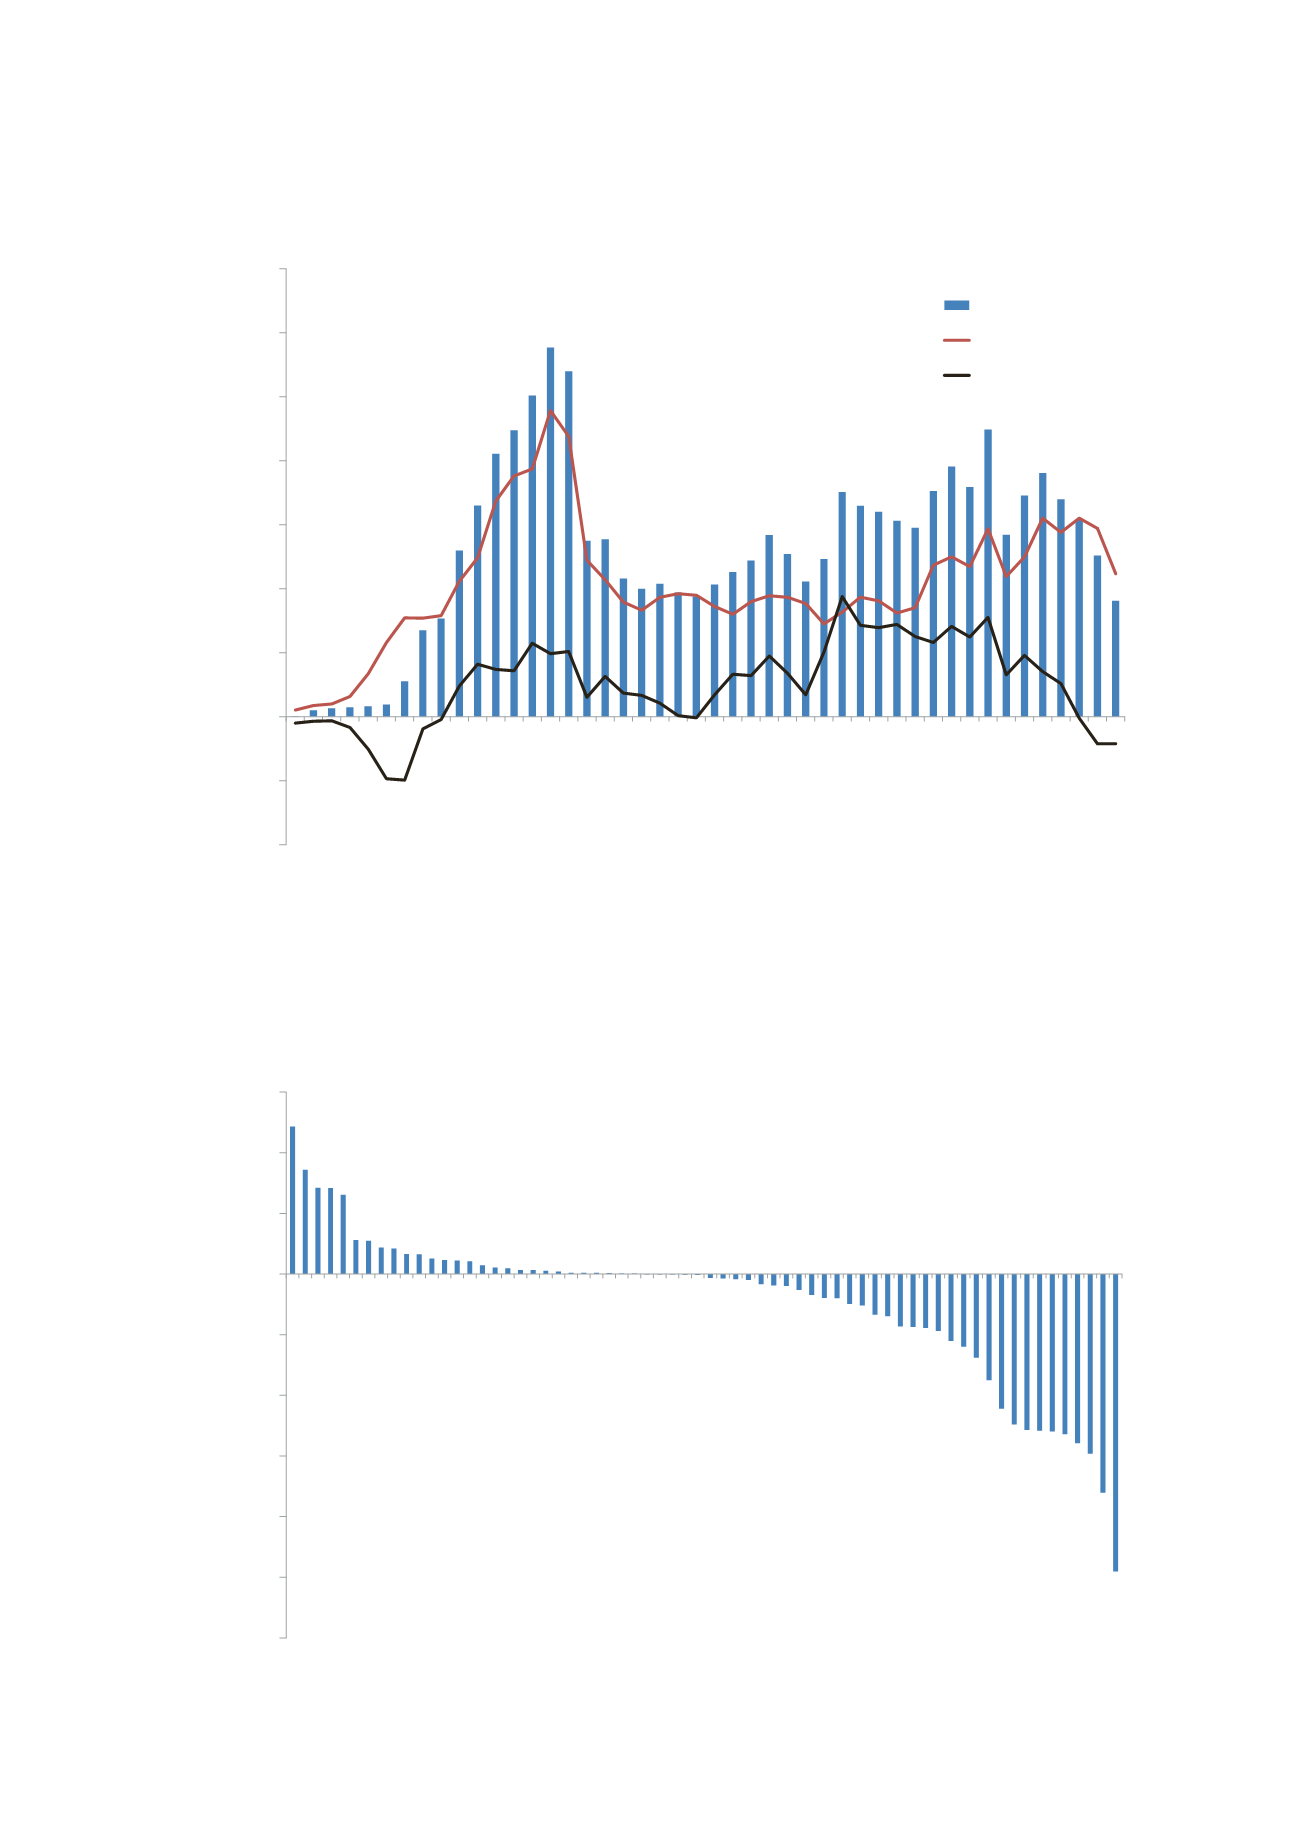
Figure 40: Revenues, Costs and Cash Flow on the UK Continental Shelf
-20
-10
0
10
20
30
40
50
60
70
1970
1971
1972
1973
1974
1975
1976
1977
1978
1979
1980
1981
1982
1983
1984
1985
1986
1987
1988
1989
1990
1991
1992
1993
1994
1995
1996
1997
1998
1999
2000
2001
2002
2003
2004
2005
2006
2007
2008
2009
2010
2011
2012
2013
2014
2015
Cash Flow (£ Billion - 2015 Money)
Gross Revenue
Post-Tax Costs
Post-Tax Cash Flow
Source: Oil & Gas UK, OGA
Figure 41 shows this picture on a company by company working interest basis. Only five companies generated
free cash flow in excess of $200 million in 2015. Lower prices mean that this number is likely to fall in 2016.
This strongly illustrates the scarcity of internally generated funds for much needed reinvestment into the UKCS.
Figure 41: Free Cash Flow Generation by Company in 2015
-1,200
-1,000
-800
-600
-400
-200
0
200
400
600
Company Cash Flow ($ Million - 2015 Money)
Source: Wood Mackenzie