


 49 / 60

page 49
Industry Profitability
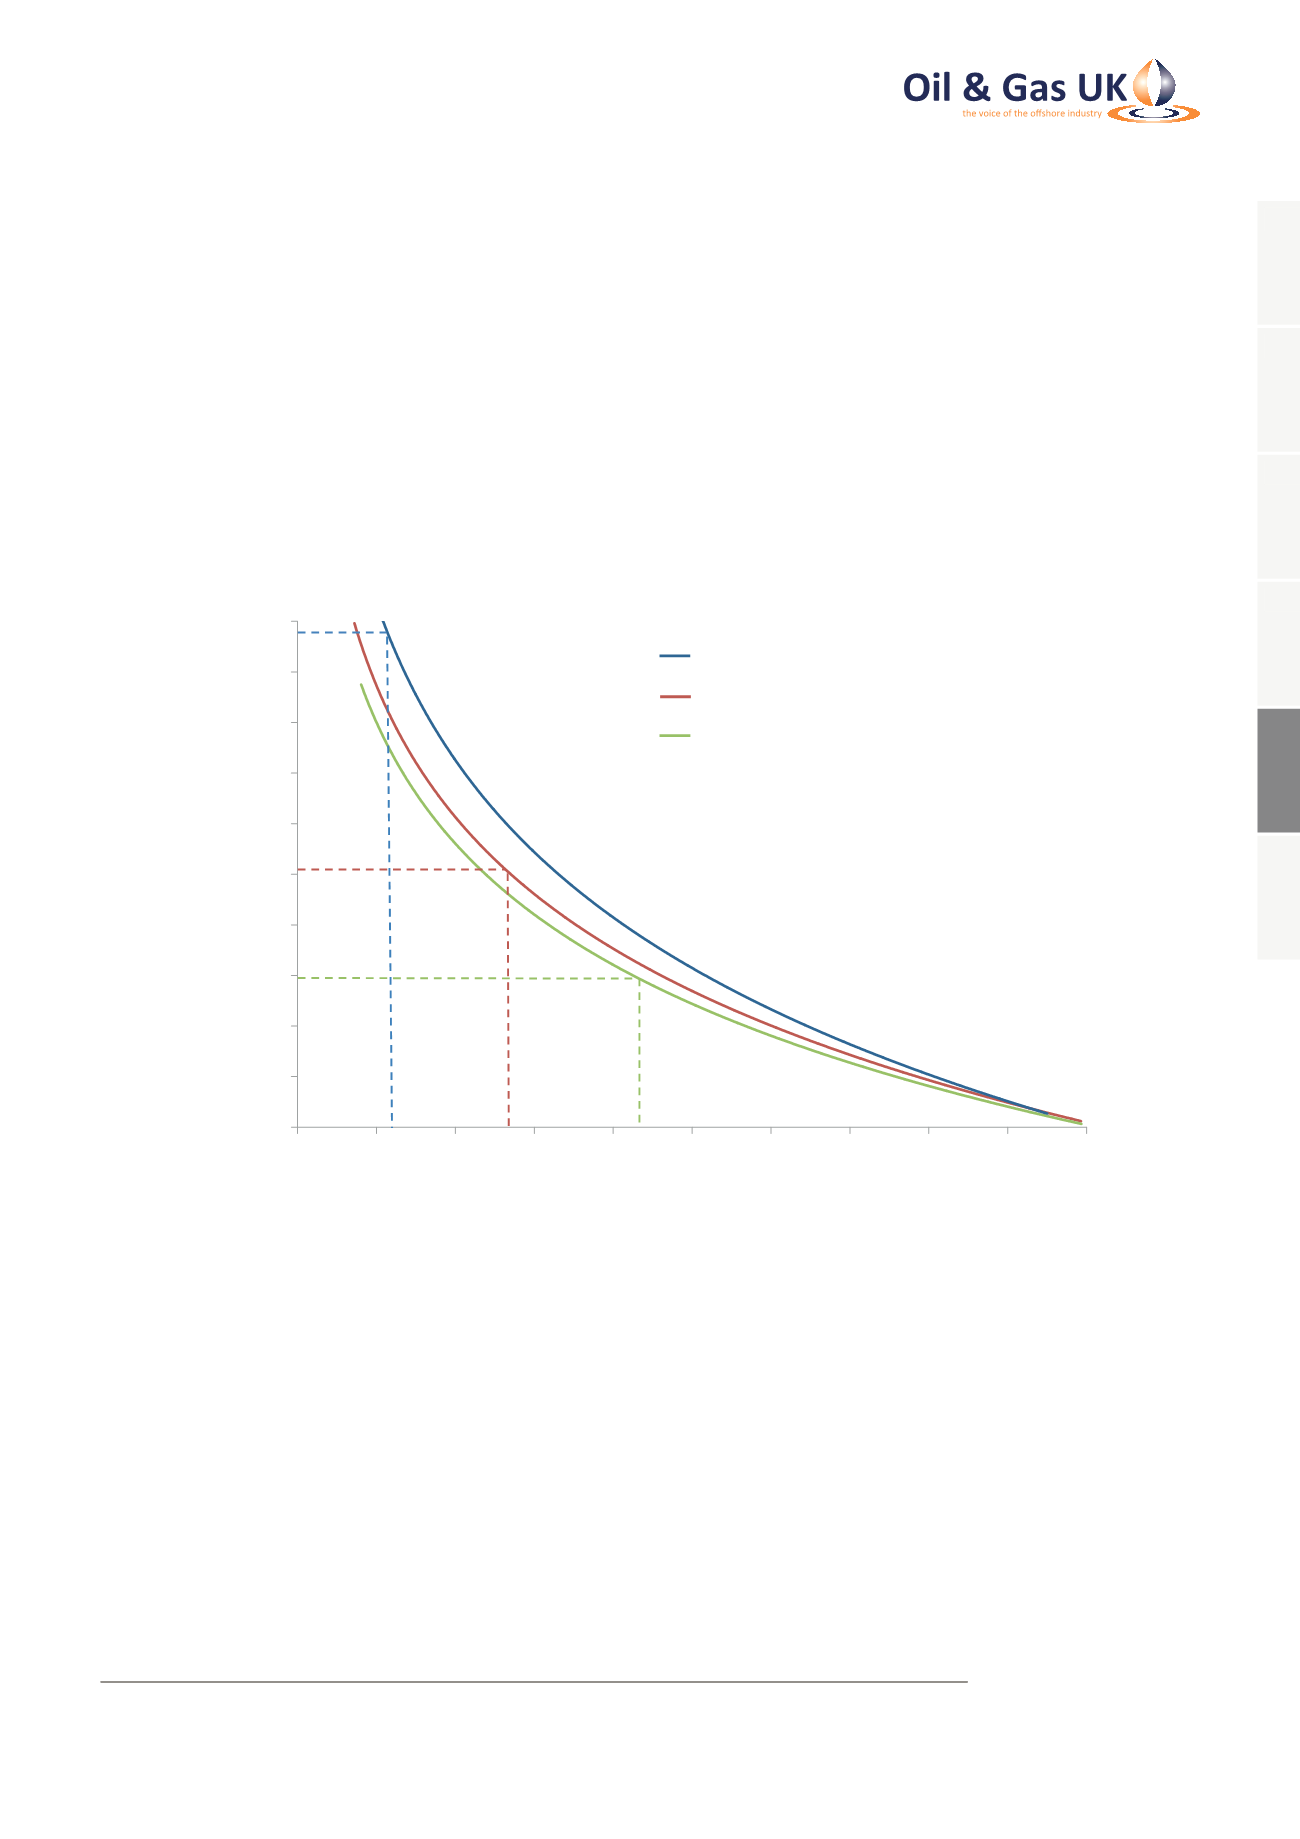
Figure 39 focusses on the cost of operating an asset safely without accounting for capital, corporate overhead,
general administrative, or abandonment costs. Even on this simplified basis, over 40 per cent of fields (or more
than 15 per cent of total production) on the UKCS are operating at a unit cost higher than the prevailing oil price
around $30/bbl at the time of writing. Even those fields that are able to stay in a positive cash flow position are not
generating sufficient margins for reinvestment after other costs and returns to shareholders. In an industry where
returns on existing assets are often the source of new project funding, it is no surprise that fresh investment in the
UKCS is set to plummet over the next few years (see section above on capital investment).
Figure 39: Proportion of Oil Fields Operating at a Loss
0
10
20
30
40
50
60
70
80
90
100
0% 10% 20% 30% 40% 50% 60% 70% 80% 90% 100%
Oil Price ($/bbl)
Percentage of UKCS Oil Fields Operating at a Loss
2014 UKCS Oil Field UOCs
2015 UKCS Oil Field UOCs
2016 UKCS Oil Field UOC Forecast
Source: Oil & Gas UK
This position is further evidenced by Figure 40 overleaf. As the average oil price fell from $99/bbl in 2014 to
$52.50/bbl in 2015, there was a £4.2 billion free cash flow deficit across the sector despite the £5 billion reduction
in total expenditure.
Even if expenditure falls by another £3-4 billion this year, revenues will fall by a greater amount if the average
output price falls below $35/bbl
18
. In summary, despite industry demonstrating substantial progress on cost
reduction and production performance, the cash flow position is still likely to worsen during 2016 unless there is
a sharp recovery in price.
18
The average output price is derived by weighting production over an estimated average oil price of $40/bbl and an
estimated average gas price of 32 p/therm.
1
2
3
4
5
6