


 54 / 60

ACTIVITY SURVEY
2016
page 54
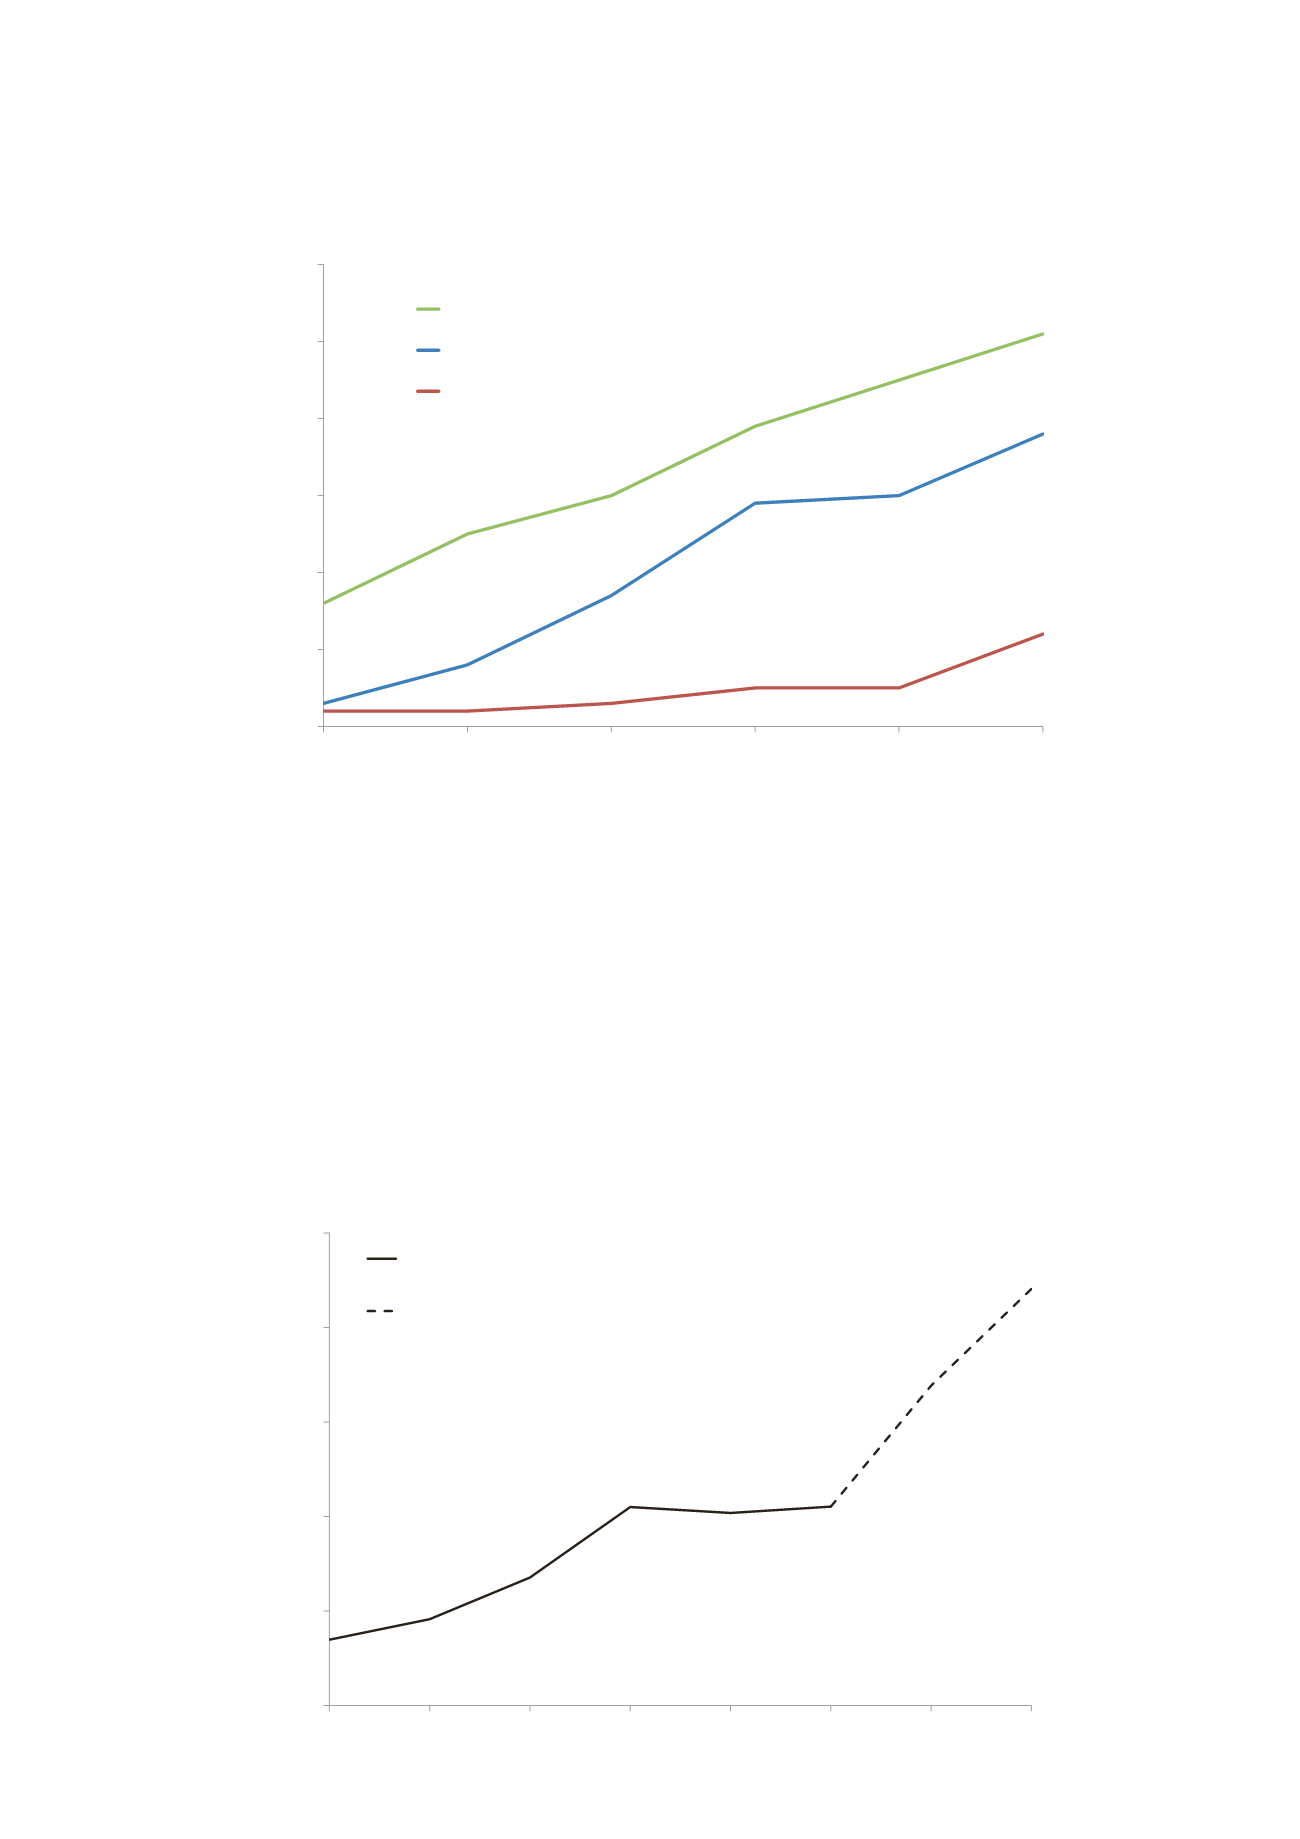
Figure 44: Cumulative Number of Fields Ceasing Production by Region
0
10
20
30
40
50
60
2015
2016
2017
2018
2019
2020
Cumulative Number of Fields Ceasing Production
SNS, Irish Sea
CNS
NNS
Source: Oil & Gas UK
Decommissioning Expenditure
In 2015, decommissioning spend on the UKCS was £1.05 billion. This is significantly lower than the £1.5 billion
forecast in the
Activity Survey 2015
, partly because decommissioning activity on some fields was deferred,
but mainly because a number of projects significantly reduced levels of decommissioning expenditure and
very few of the fields that ceased production during 2015 incurred material decommissioning costs within the
year. As these fields move from the cessation of production stage to the decommissioning stage, we expect
expenditure to rise to over £2 billion by 2017. The outlook towards the end of the decade will be determined
by the industry’s ability to manage its assets in a way that enables it to remain cash-flow generative even if
low prices persist.
Figure 45: Annual Decommissioning Spend
0.0
0.5
1.0
1.5
2.0
2.5
2010
2011
2012
2013
2014
2015
2016
2017
Annual Decommissioning Expenditure
(£ Billion - 2015 Money)
Historic Decommissioning Spend
Forecast Decommissioning Spend
Source: Oil & Gas UK