
L’A
TLAS
DU
M
ONDE
DIPLOMATIQUE
I
11
Surface area of the ice cap
Million km
2
1900 1920 1940 1960 1980 2000
16
14
12
10
8
6
4
2
0
Sources:
Impacts of a Warming Arctic: Arctic Climate Impact Assessment (ACIA) Overview report
, Cambridge University
Press, 2004; Hadley Centre, 2005; World Meteorological Organization (WMO), 2005; Met Office (UK).
1973 1980
1990
2000 2004
-1
0
1
Variation in the area of the ice cap compared with
the average for 1973-2004
Million km
2
- 2
2
Annual average
Winter (average January to March)
Summer (average July to September)
Monthly average
Annual average
�������������������������������������������������������������
����� ������ ��� �� ���� ������ ��� ��� �� � ���� �������
��������
�����
������
�����
����
���
�������
�����
�������
���
��������
���
�����
���
����������������������
������������
°
�
������������
°
�
������������
°
�
����������
°
�
����������
°
�
������������
°
�
���������
°
�
faster
satellite currently indicate a 2.4 mil-
limetre annual rise in sea level. That
would result in a rise of at least 25
centimetres by the start of the next
century, but increasing numbers of
scenarios are forecasting a rise of one
or several metres, if melting of certain
parts of the Antarctic is confirmed. Set-
ting aside such uncertainty, it appears
that a third of the rise is caused by
dilatation of the sea water due to the
temperature increase. Melting glaciers
account for a further third. As for the
remainder, recent studies suggest that
melted ice from the South Pole could
already be accounting for as much as
15% of the total rise.
RISING SEA LEVEL
Until very recently scientists thought
only the Antarctic peninsula was affec-
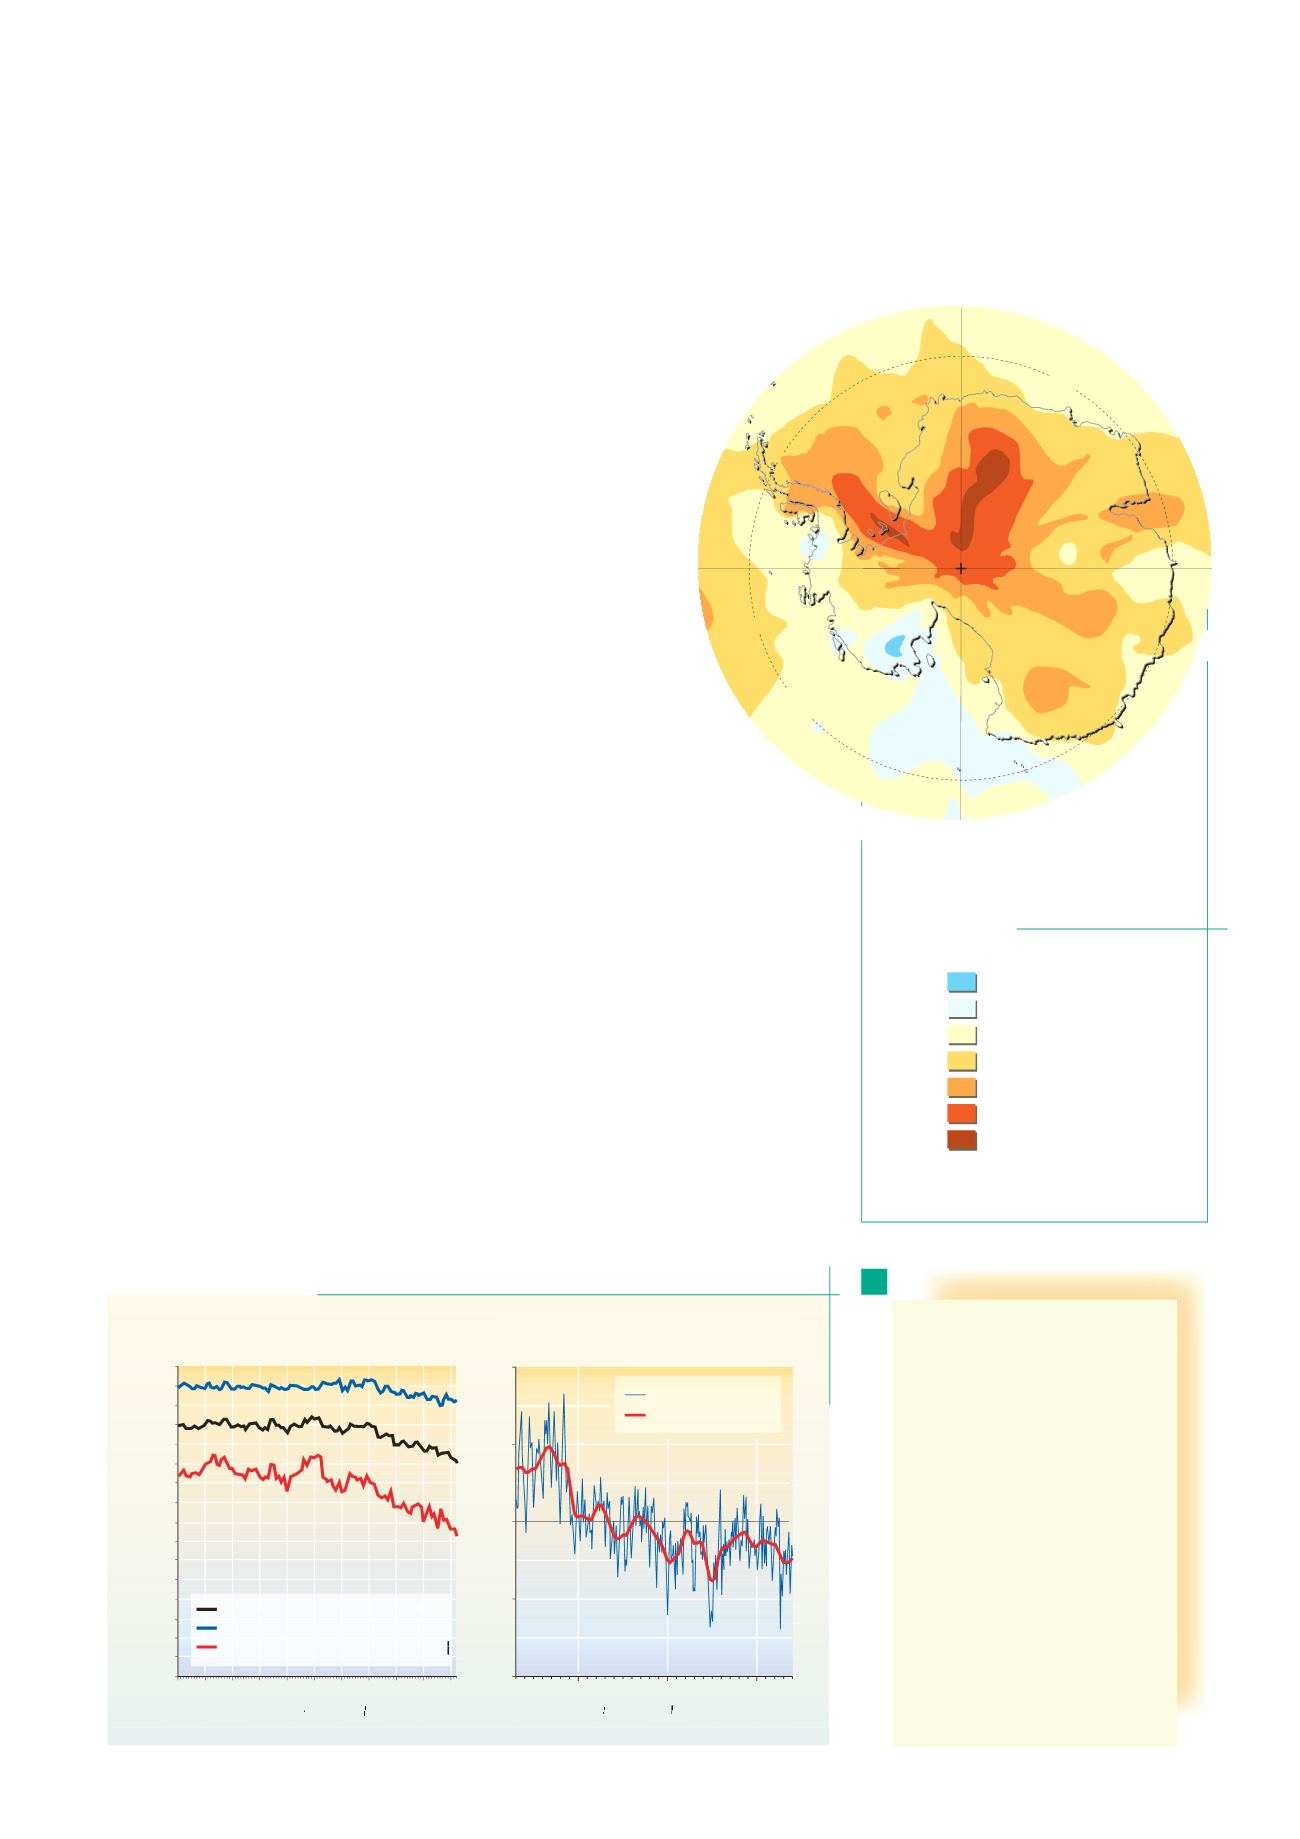
ted. It warmed up 3°C between 1974
and 2000 and it was here that the huge
Larsen ice shelf broke free in 2002.
If all the ice on the peninsula melted
the sea level would rise by an addi-
tional 45 centimetres. However it is
not directly connected to the southern
polar ice cap which, until recently, was
thought to be stable and unlikely to
be affected by global warming for at
least a century. Then, inOctober 2004,
Nasa revealed that the temperature of
some parts of the continent
might increase by more
than 3.6°C by 2050.
In December 2004
a team belonging to
the British Antarctic
Survey observed that
the western part of
Antarctic was losing
250 cubic kilome-
tres of ice a year.
It remains a relati-
vely small amount,
but if the rate of loss
increased, water from
this area could ultimately
raise the sea level by 8metres.
For the time being only Eastern
Antarctic, much the largest part (equi-
valent in ice to a 64 metre rise in sea
level), appears to have been spared.
In addition a reduction in the Antarctic
ice pack could have a disastrous effect
on aquatic wildlife. In particular krill,
a tiny shrimp that lives on seaweed
growing under the ice, play a key role in
the marine food chain, feeding squid,
fish and cetaceans. Krill stocks appear
to have dropped by 80% over the last
30 years. Combined with overfishing
worldwide and increasing damage to
the coral reefs, this undoubtedly consti-
tutes an additional source of concern.
The Arctic Ocean ice cap is receding
On the web
>
Arctic Climate Impact Assessment (ACIA):
www.acia.uaf.edu>
International Arctic Science Committee (IASC):
www.iasc.no>
Arctic Council:
www.arctic-council.org>
Center for International Climate and
Environmental Research-Oslo (CICERO):
www.cicero.uio.no>
Laboratoire d’océanographie dynamique et
de climatologie (LODYC):
www.lodyc.jussieu.fr>
World Meteorological Organization (WMO):
www.wmo.ch>
International Conference on Arctic Research
Planning (ICARP):
www.icarp.dk��������
�����
������
�����
�����
����
����
���
�������
�����
�������
��������
���
�����
���
����������������������
������������
°
�
������������
°
�
������������
°
�
����������
°
�
����������
°
�
������������
°
�
���������
°
�
Antarctic temperature
rise by 2050


