


 24 / 84

The impact of a component or
subsystem noise figure is that the
output noise power is increased above
the level of thermal noise and gain by
the noise figure.
Noise Power Out = -174dBm/Hz +
Gain(dB) + NF(dB)
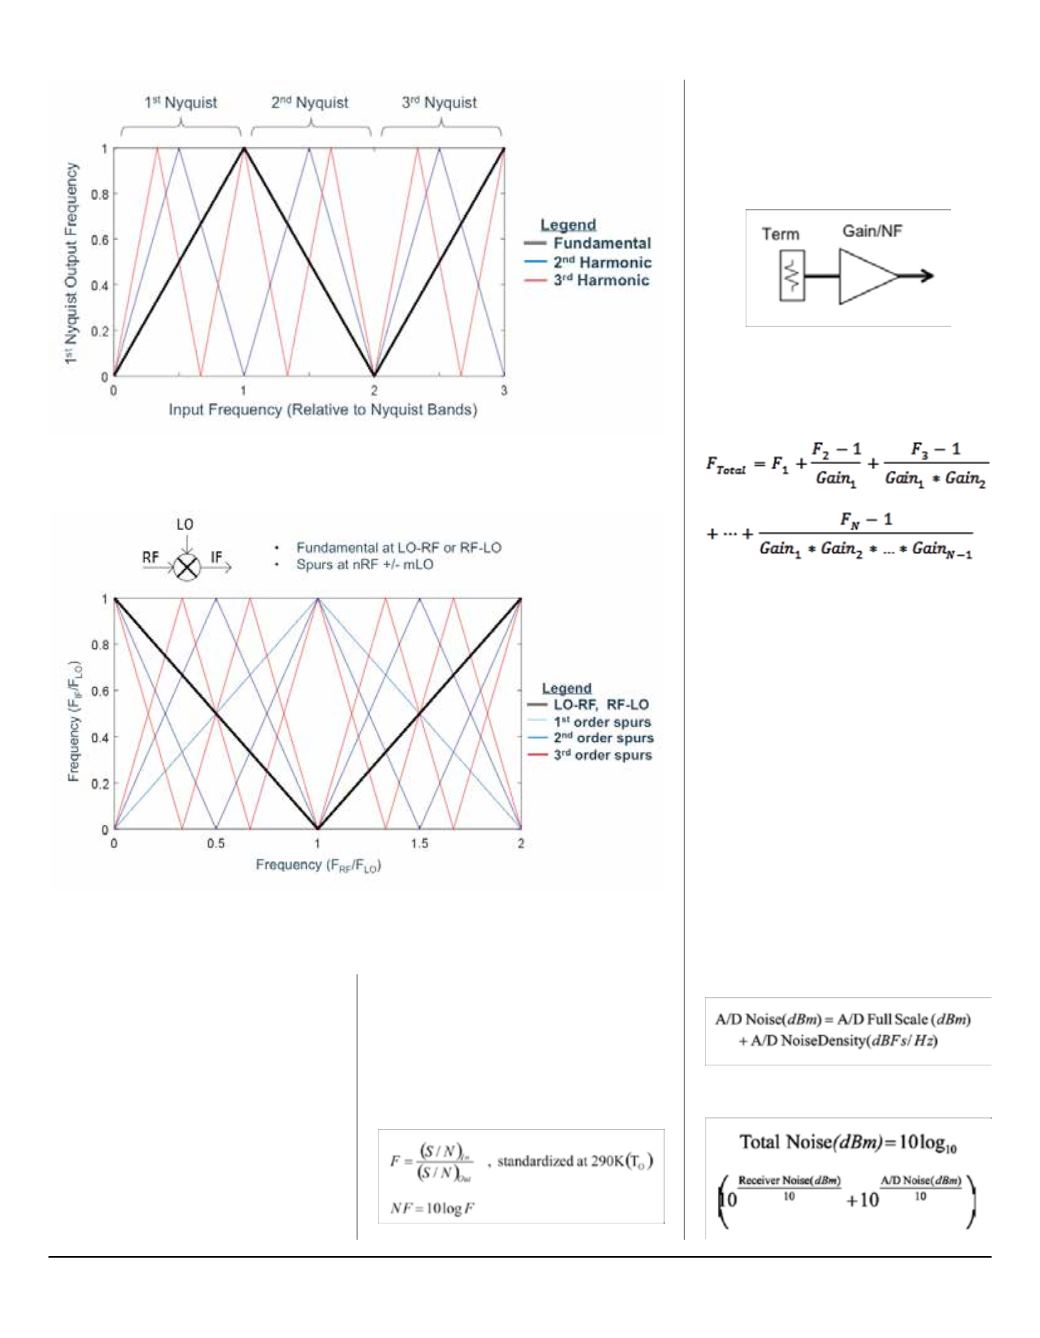
Cascaded Noise Figure is calculated
as:
The selection of receiver gain prior to
the A/D and determining the required
A/D SNR is a balance of the overall
receiver noise figure and instantaneous
dynamic range. Figure 5 provides a
representation of the parameters to be
considered. For illustrative purposes,
the receiver noise is shown to be
shaped by the anti-aliasing filter prior
to the A/D, the A/D noise is shown as
flat white noise, and the signal of
interest is shown as a CW tone at -1
dBFs.
First, common units of either dBm or
dBFs is needed. Converting the A/D
noise from dBFs to dBm is known from
the converter full scale level and the
converter noise density.
The total noise is calculated as
Figure 4: Downconversion mixer spurious
Figure 3: A/D Frequency folding
are considered which quickly creates
a spur free dynamic range issue for
the designer. For narrow fractional
bandwidths, meticulous frequency
planning can overcome the mixer
spurious problems. As bandwidths
increase, the mixer spurious problem
becomes a dominant obstacle. As A/D
sampling frequencies increase, it is
sometimes more practical for a direct
sampling architecture to have lower
spurious performance.
Receiver Noise
Much receiver design effort is placed
on minimizing noise figure (NF). Noise
figure is a measure of the degradation
in signal to noise ratio.
24 l New-Tech Magazine Europe