


 55 / 122

Southern Corridor GRIP 2017–2026 |
55
10
15
25
35
30
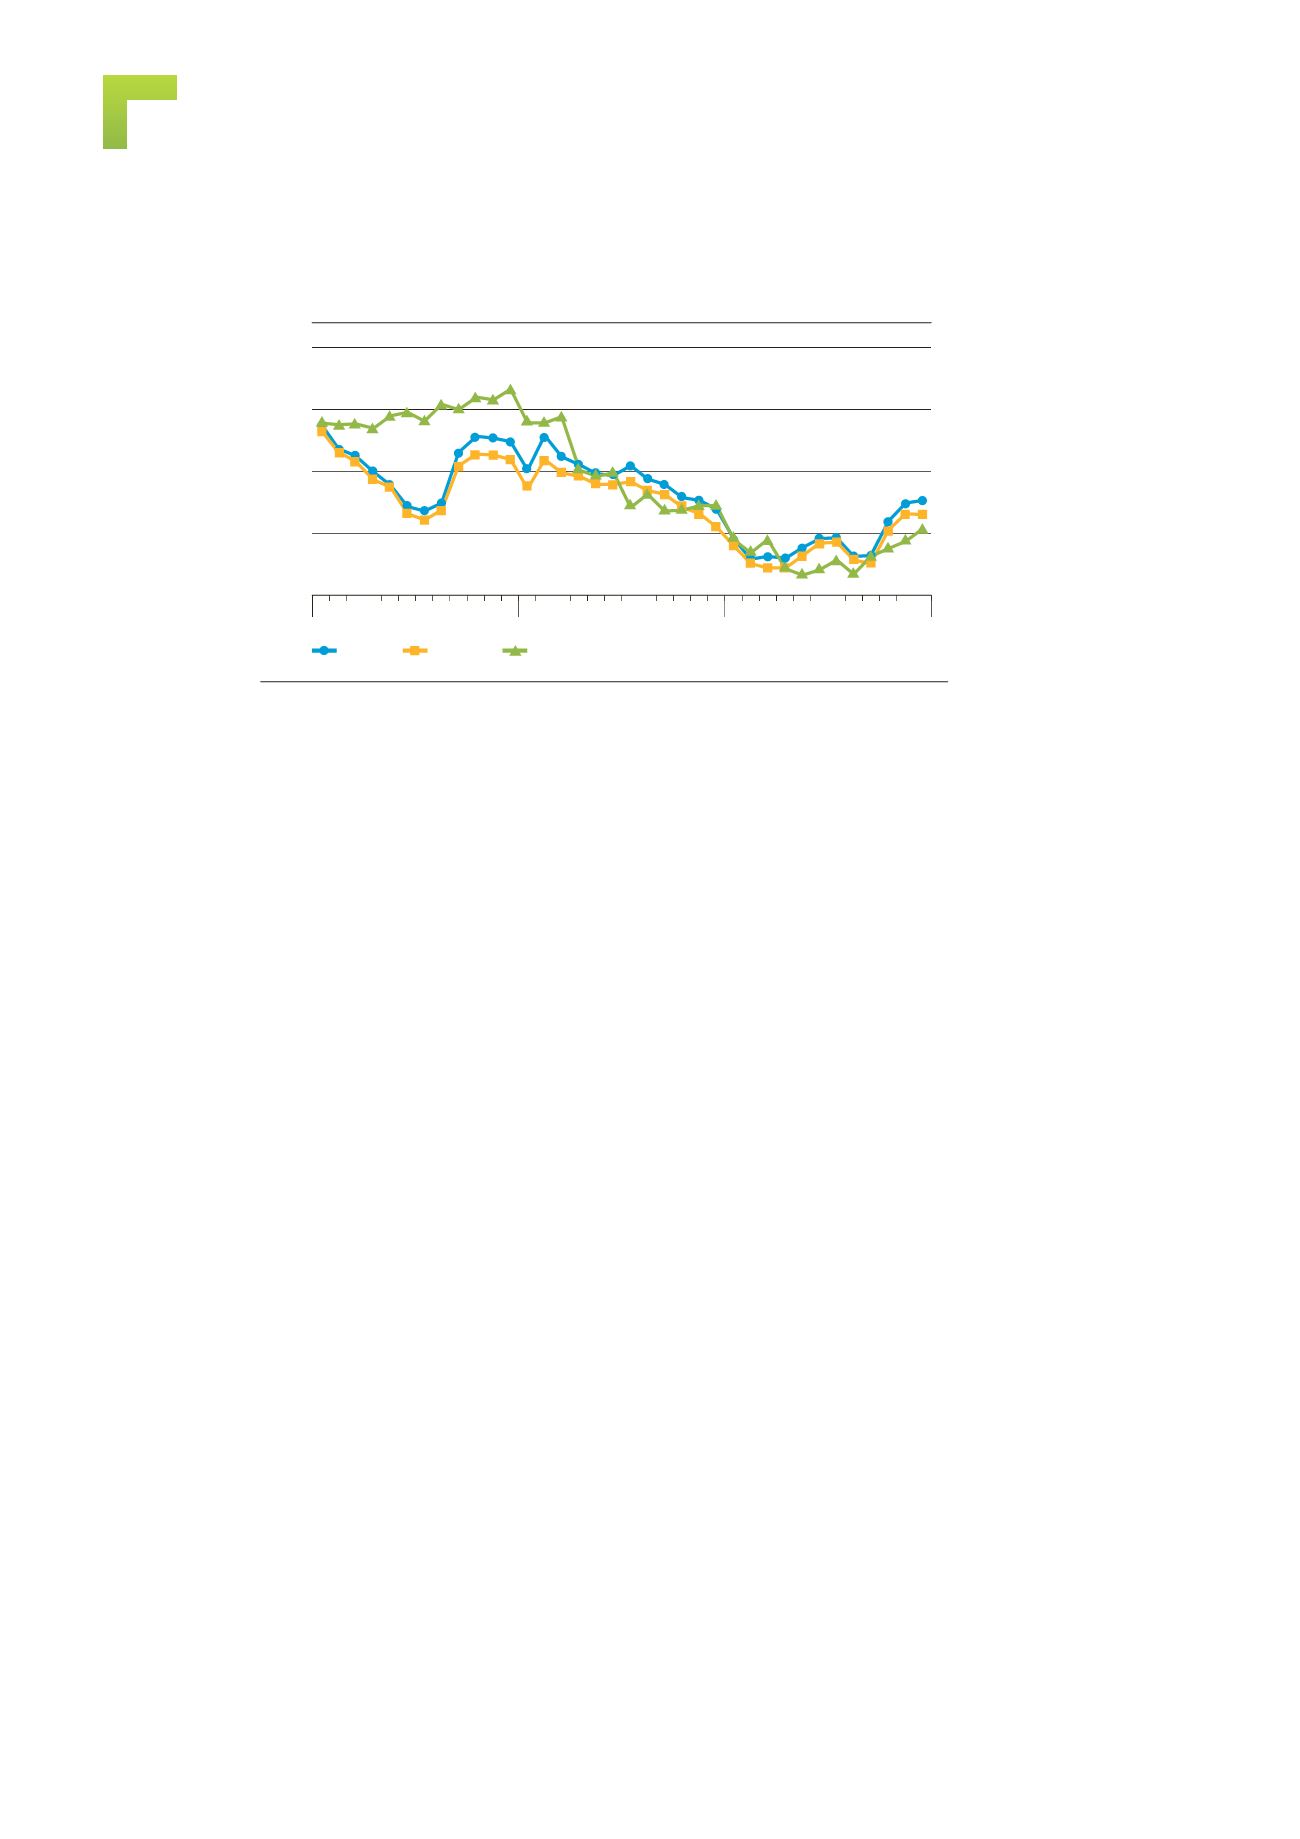
€/MWh
Gas day-ahead averages on Hubs (AT & IT) and monthly import average prices (GR)
01 02 04 06 08
10
12
03 05 07 09
11
01 02 04 06 08
10
12
03 05 07 09
11
01 02 04 06 08
10
12
03 05 07 09
11
2014
2015
2016
PSV
CEGH
GR
Figure 4.8:
Comparison of gas prices in the SC region
4.3 Prices
Although during the recent years the alignment with the most liquid EU markets
significantly improved, the hubs and import prices in the region remain in general
slightly higher than those of the markets of Central and Western Europe.
Figure 4.8 shows more in detail the differences between the main three regional gas
markets providing the historical evolutions of prices from 2014 to 2016 with monthly
granularity.
The most evident trend is the alignment among the three countries price levels until
the beginning of 2015 when the mostly oil-linked contract prices applying in Greece
marked an important decrease compared with the more market related Austrian and
Italian prices, resulting therefore aligned with the more liquid markets of the Western
parts of the region (Austria and Italy). We find here below the result of the still
persistent separation between the Greek market and the more liquid markets of the
Western parts of the region. On the three-year period the average of the differences
between the most and the least priced hubs in the Region is around 3.7€/MWh.
More specifically, the graph also reveals:
i.
A consolidated price-alignment between the Italian and the Austrian hubs,
particularly strong during the first and the final parts of the analyzed time
horizon, never exceeding a gap of 2.5€/MWh and even 1.4€/MWh in 2016
(monthly average difference below 1.1€/MWh during the 3-year period
2014–2016). The link between these two hubs performances is following a
more general correlation trend shown by all EU major hubs during the last
years.
ii.
The persistence of a consistent positive amount to be paid for Greek imports
during 2014 and the first quarter of 2015, which firstly disappeared during the
second quarter and, finally, turned into a negative price position during the
remaining part of the same year. This trend is probably explained by the oil pric-
es collapse happened in the second half of 2014 and then transferred – with
the typical 6–9 months gap – to Greek gas prices (mainly set on the basis of
long-term-oil-linked import contracts).
iii.
The lower effect of winter climatic conditions on the Greek prices (lack of price
surges registered at PSV and CEGH) which, together with the current lack of
interconnections, isolated Hellenic price from upward pressure in periods of
winter peak demand. Future planned interconnections should partially export
price oscillations linked to climatic conditions, having a bi-directional stabilising
role on gas quotations.
Widening the analysis scope to a European scale, it is possible to appreciate even
more clearly the progressive downward and alignment trend already described
above for the three regional marketplaces.