


 12 / 96

12
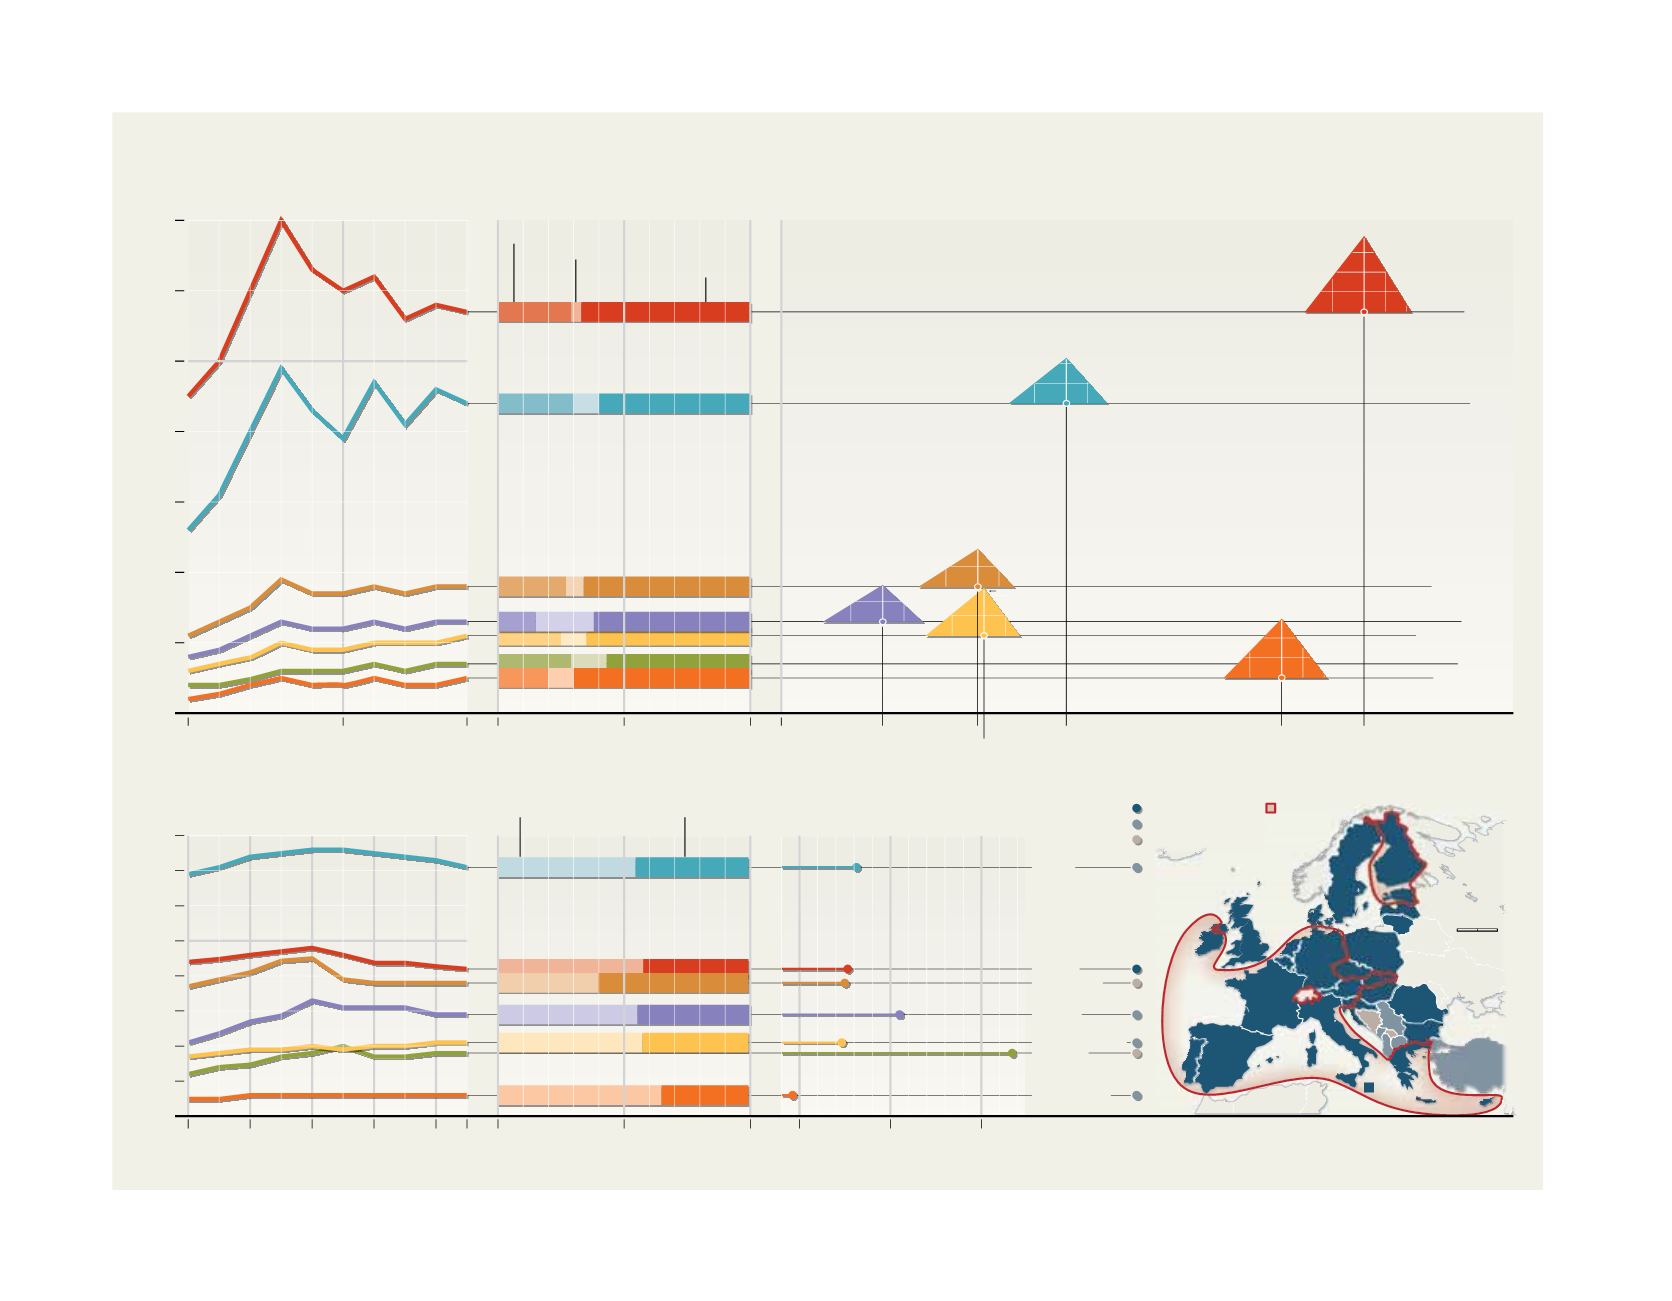
European Union membership status
Candidate country
Potential candidate
Member state
Euro Zone
500 km
Distribution of population (%)
Millions
Population
People per km
2
Population density
Rural
Urban
2014 0
50
50
100
150
1970
2010
1980 1990 2000
Croatia
Serbia
Albania
Bosnia and
Herzegovina
FYR Macedonia
Kosovo*
Montenegro
No data for Kosovo*
8
6
7
4
5
3
2
1
0
GNI per capita in PPP terms
2014
0.812
0.789
74.8
74.1
9.5
8.2
75.2
77.4
9.3
11 301
10.5
14 710
9 225
11 745
0.745
8.3
76.4
9 431
0.731
0.716
0.700
0.732
77.0
11.0
19 025
0
50
100%
100%
No data for Kosovo*
2010
2005
0
10 000
20 000
30 000
40 000
50 000
70 000
60 000
Croatia
Serbia
Albania
Bosnia and
Herzegovina
FYR Macedonia
Kosovo*
Montenegro
Millions of USD
Gross Domestic Product
GDP percentage
by sector
Human Development Index
Life expectancy
at birth
HEALTH
EDUCATION
Meanyears
of schooling (adults)
INCOME
constant 2011 international dollars
Agriculture
Services
Industry
Socio-economic indicators
Sources:TheWorldBankDatabank
(databank.worldbank.org,accessOctober2015);
UN,2015, “WorldUrbanizationProspects.The2014Revision”,UnitedNationsPopulation
Division;UNDP,2014, “HumanDevelopmentReport”
;europa.eu(accessOctober2015).
*This designation is without prejudice to positions on status, and is in line with
UNSCR 1244/99 and the ICJ Opinion on the Kosovo declaration of independence.
Copyright© 2015GRID-Arendal • Cartografare ilpresente/NievesLópez Izquierdo