


 7 / 16

World Ocean Assessment Overview
7
- less water and more competition for its use as population grows
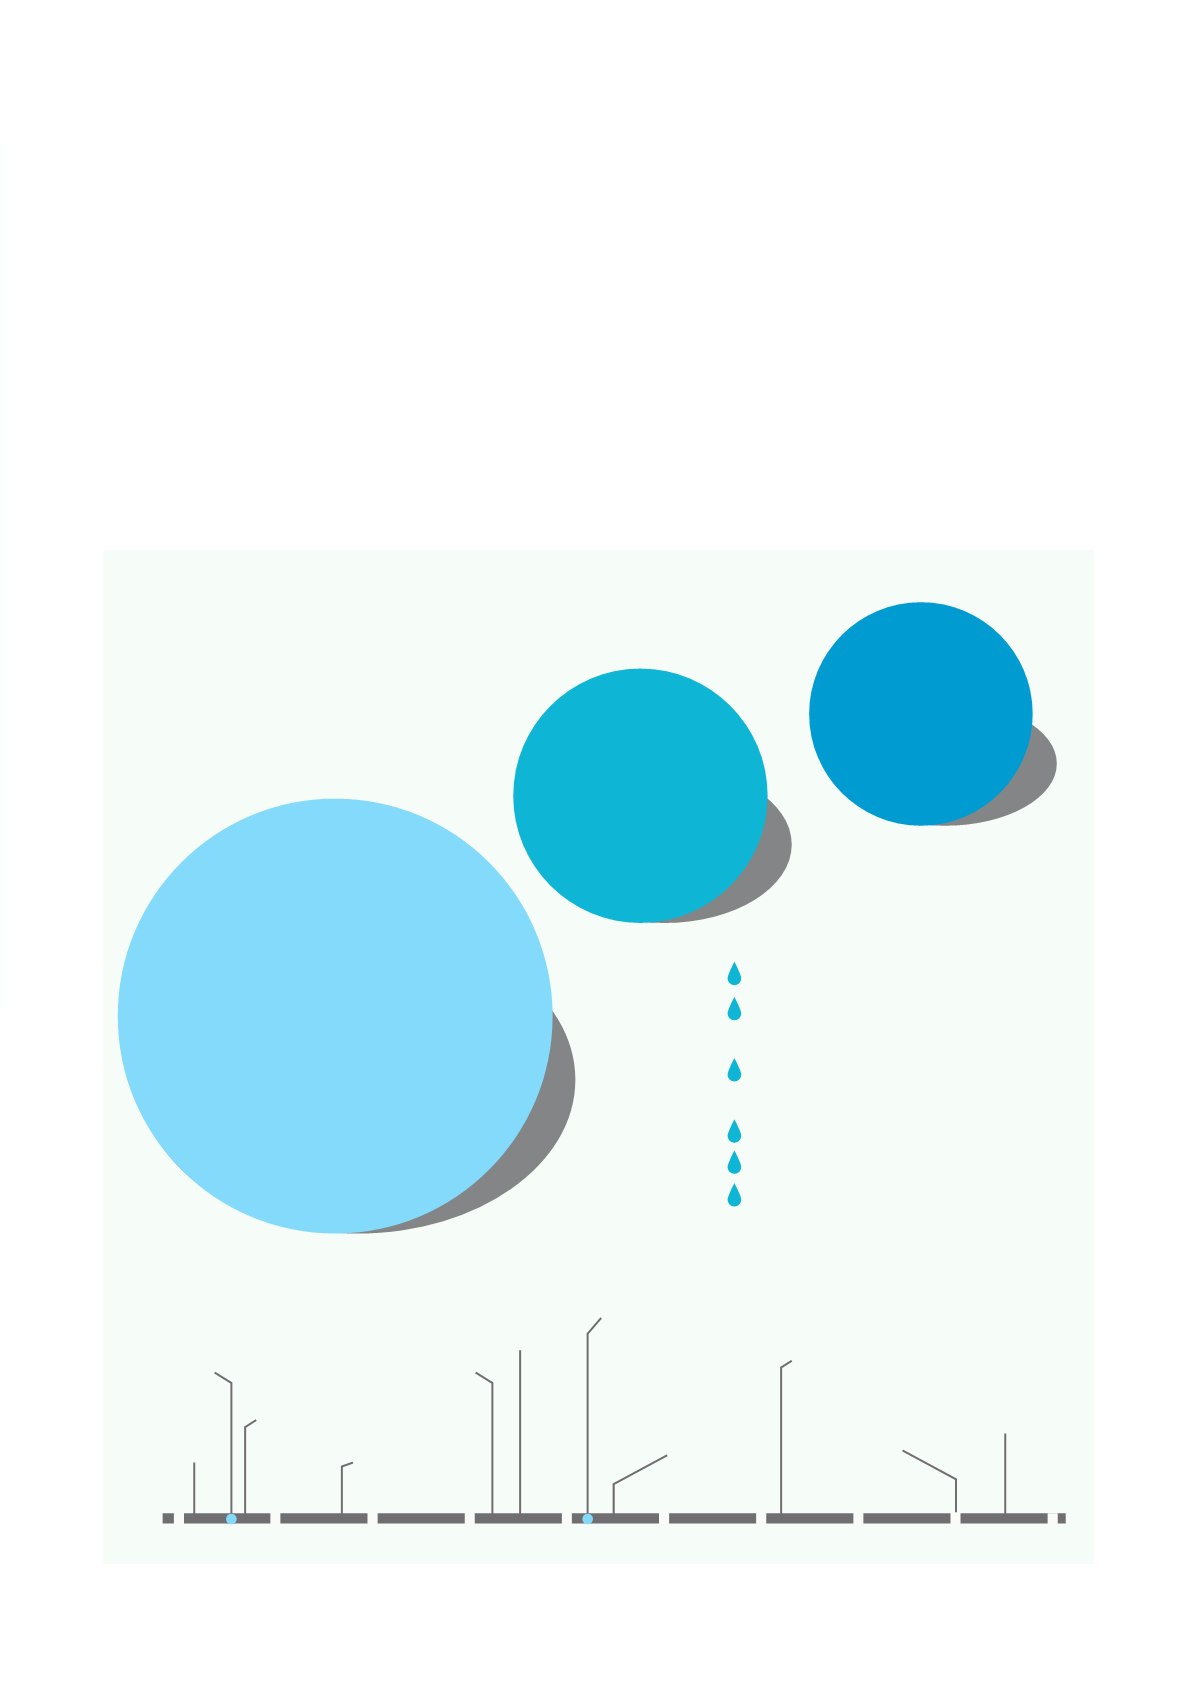
Ocean water per person, 1950 – 2050
Timeline of some of the key pressures, impacts and responses related to theWOA themes
As population increases
1950
2015
2050
1/2 km
3
per person
1/8 km
3
per person
1/5 km
3
per person
1950
2000
1960
1970
1980
1990
2010
2020
1930
1940
First o shore
oil rig
Collapse of the Atlantic
northwest cod shery
Plastic shopping
bags introduced
Kitchen
paper towel
introduced
Popular herbicide
introduced
Expansion of mass
tourist industry
El Niño induced
coral bleaching
Plastic bottles
commercially
available
First MPA
London Convention
(prevention of marine
pollution by dumping)
Deepwater Horizon
oil spill
Decreasing water volume per person
Declining numbers of commercial sh
species in some areas
Reduced biodiversity
Increasing invasive species
Change in distribution – range expan-
sion or contraction of some marine
populations
Declining water quality, especially
around highly populated coastal areas
over 70%
Percentage of population living within
100 km of the coastline
30 to 70%
less than 30%
none
million people
50
40
30
20
10
in 2015
estimated by 2050
coastal city with more than 100,000 inhabitants
If we divide up the ocean among the current 7 billion human
inhabitants of Earth, we each have only one fifth of a cubic
kilometer of ocean. That relatively small amount of water
generates half the oxygen we breathe in a year, all of the
seafood that we consume, a third of the oil and gas we burn,
as well as other commodities that we use. Our ever-growing
population is the ultimate driver for increased use of these
resources and access to ocean space.
Source: Introduction to Summary of WOA, page 1 and themes addressed in the WOA.