


 8 / 16

World Ocean Assessment Overview
8
90
0
30
60
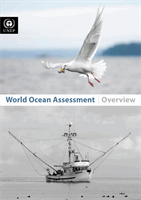
- in million tonnes
Year
50
10
05
00
95
90
55
60
65
70
75
80
85
Evolution of world’s capture of marine species
Source: SOFIA (FAO 2014)
0
500
1000
1500
2000
1980
1985
1990
1995
2000
2005
2010
2013
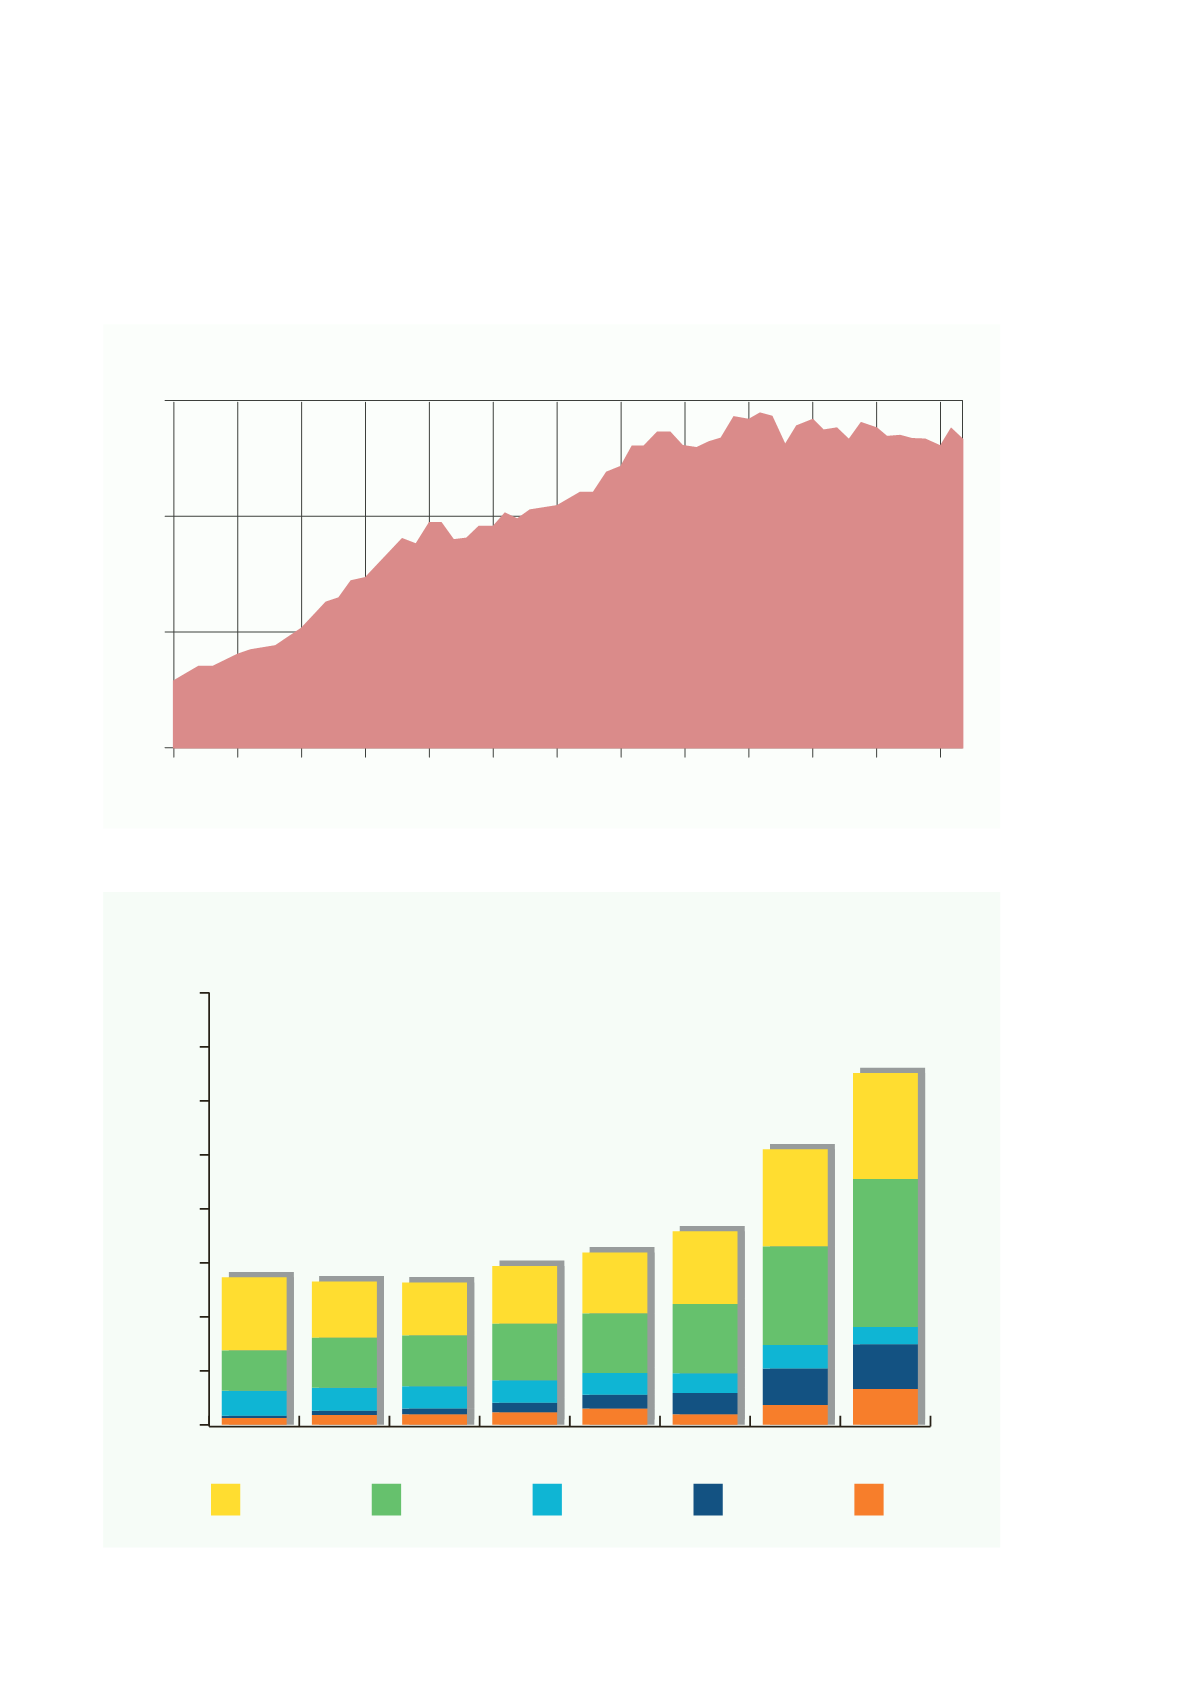
Oil tanker
Dry bulk
General cargo
Container
Other
- the world’s eet of ships has been increasing rapidly since 2000
Year
Total size of the world´s eet of ships 1980 – 2013
Source: UNCTAD, 2013
Our growing population means increased human activity and a greater use of the ocean every year (e.g. increases
in fishing, ship transport, marine based tourism, exploitation of non-living resources, etc.). Human activities exert
‘pressures’on the environment through production or consumption processes (Ref. Summary of WOA, Theme E, page 8).
Example of increase in pressures through consumption in the fisheries sector (Ref. WOA Summary, page 16).
Example of increase in pressures through global growth of shipping fleets (Ref. WOA Summary, pages 23 to 24).
Pressures
Activities that put pressure on the environment