


 43 / 74

43
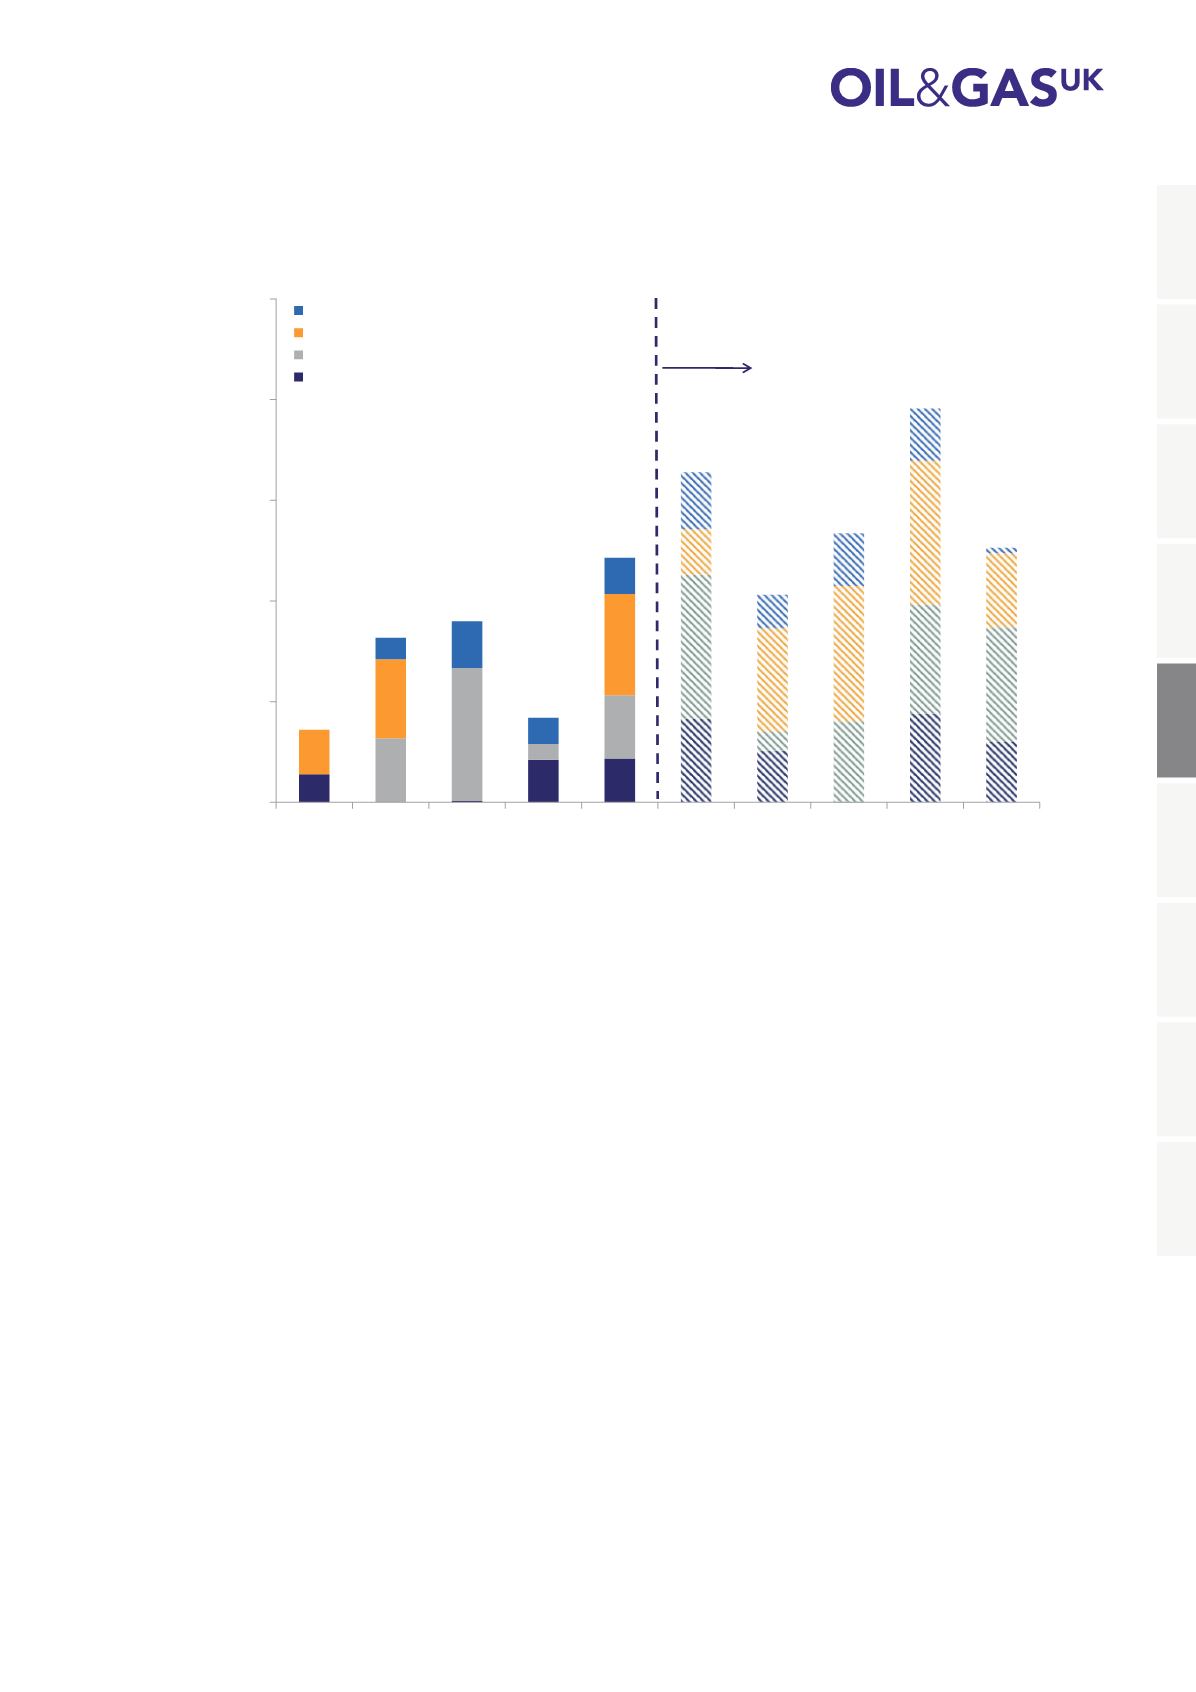
Figure 29: Combined Forecast of Tonnage Coming Onshore for Recycling and Disposal
on the UK and Norwegian Continental Shelves
0
50,000
100,000
150,000
200,000
250,000
2016 2017 2018 2019 2020 2021 2022 2023 2024 2025
Total Weight (Tonnes)
Southern North Sea and Irish Sea
Northern North Sea and West of Shetland
Central North Sea
Norwegian Continental Shelf
Source: Oil & Gas UK
Increased Uncertainty
in Forecasts
1
2
3
4
5
6
7
8
9