


 49 / 74

49
1
2
3
4
5
6
7
8
9
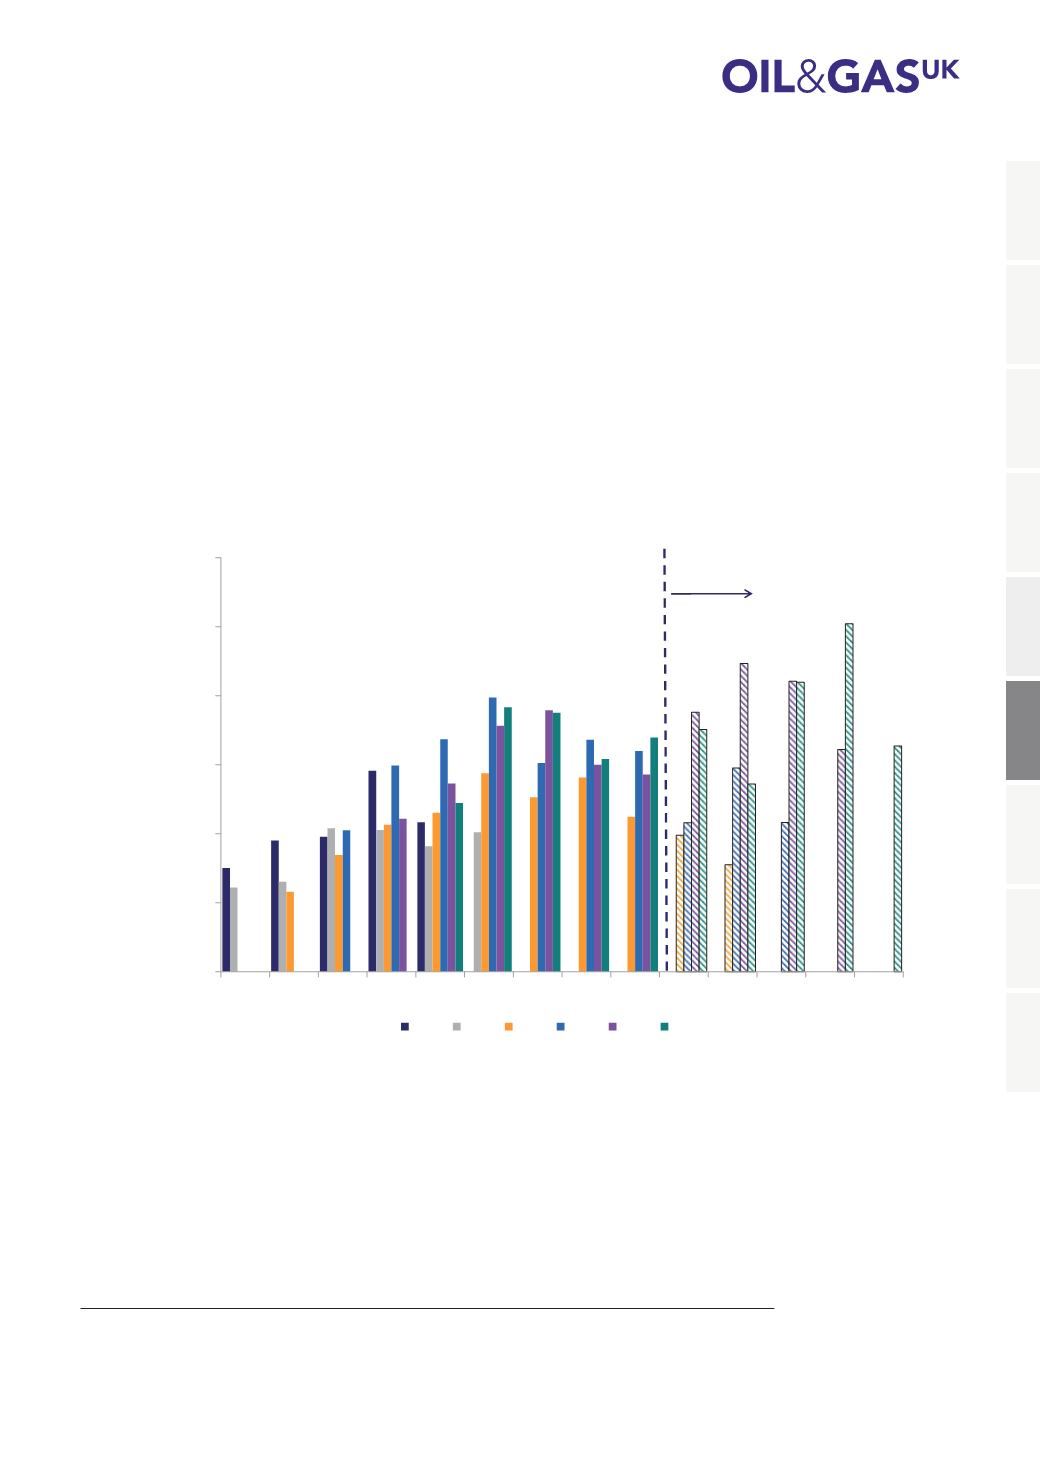
Historical Comparison of Annual Forecasts
Data for the UKCS from previous
Decommissioning Insight
reports (2011 to 2015) have been used to compare
annual forecast expenditure. As illustrated in Figure 34, near-term (2016 to 2019) expenditure forecasts are
broadly similar to those in the 2015 report, although a mixture of project deferrals and some projects being
brought forward has led to a slight change in the profile. Although expenditure is still expected to rise this year to
£1.2 billion, the estimated increase has been revised downwards due to some expenditure slipping over the last
12 months. This means the forecast for 2017 is now almost £2 billion
25
.
Over the next ten years, the average annual forecast expenditure is now just under £1.8 billion, an increase on
the £1.7 billion reported in 2015. This comes from the inclusion of new projects in the survey, with much of the
associated expenditure occurring towards the end of the survey timeframe peaking in 2024.
Figure 34: Comparison of Annual Forecast Decommissioning Expenditure on the UKCS
0
500
1,000
1,500
2,000
2,500
3,000
2012 2013 2014 2015 2016 2017 2018 2019 2020 2021 2022 2023 2024 2025
Forecast Expenditure (£ Million - 2015 Money)
2011 2012 2013 2014 2015 2016
Increased Uncertainty
in Forecasts
Source: Oil & Gas UK
Regional Breakdown
26
Looking at the regional breakdown of UKCS decommissioning expenditure from 2016 to 2025, 53 per cent
(£9.4 billion) is estimated to be spent in the central North Sea and 30 per cent (£5.3 billion) in the northern North
Sea and west of Shetland. The remaining 17 per cent (£3 billion) is allocated to the southern North Sea and Irish
Sea, of which over 90 per cent is concentrated in the southern North Sea.
25
This survey covers data from end-of-field-life decommissioning projects and does not include expenditure or activity
associated with mid-life decommissioning.
26
All forecasts by region and component are rounded and so the sum of them may not come to the total
forecast expenditure.