


 52 / 74

DECOMMISSIONING INSIGHT REPORT
2016
52
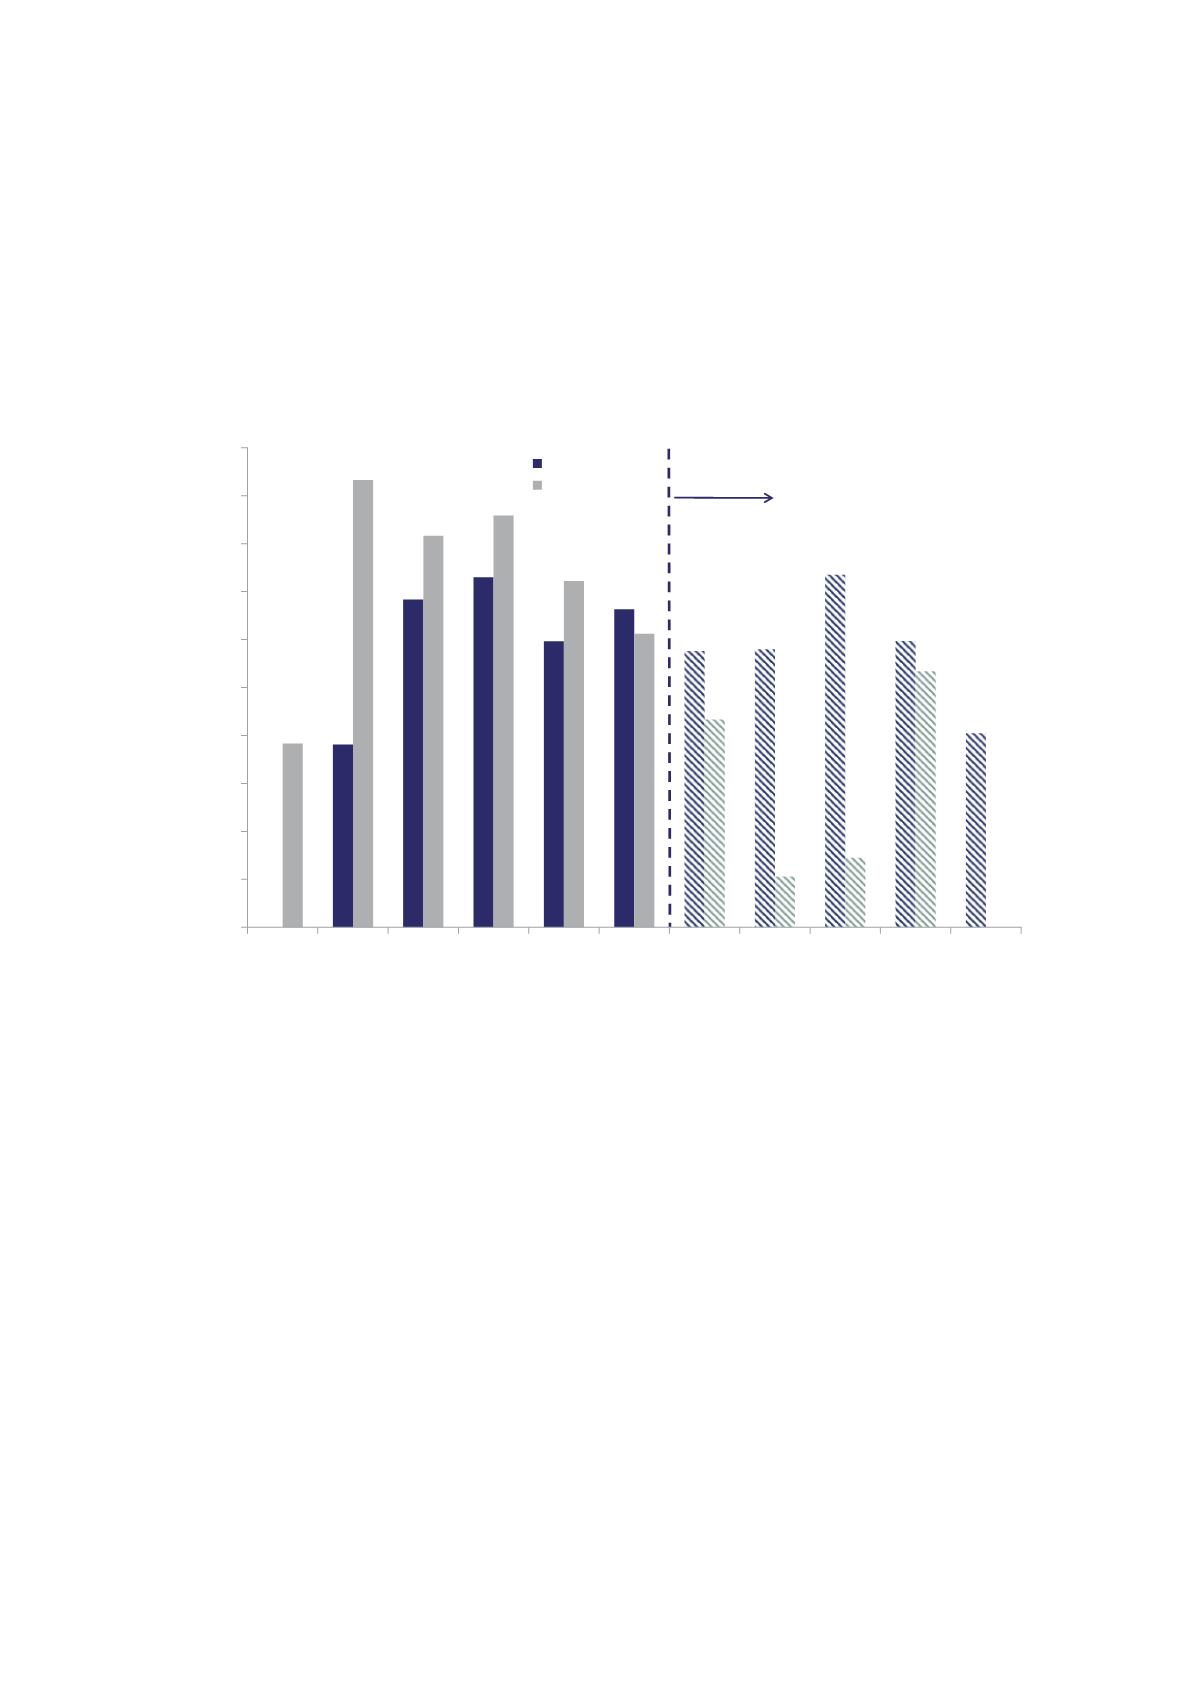
Overall, Figure 36 shows that near-term expenditure (2016 to 2019) in the southern North Sea and Irish Sea is
lower than was forecast a year ago. This can be attributed to the deferral of some activity to preserve cash-flow
in the current business climate, larger campaigns spreading their activities across the decade, and lower unit costs
for well P&A and removals. The marked increase in forecast expenditure in the latter part of the decade is due to
the inclusion of new projects to this year’s report.
Figure 36: Comparison of Forecast Decommissioning Expenditure in the Southern North Sea and Irish Sea
0
50
100
150
200
250
300
350
400
450
500
2015 2016 2017 2018 2019 2020 2021 2022 2023 2024 2025
Forecast Expenditure (£ Million - 2015 Money)
2016 Survey
2015 Survey
Source: Oil & Gas UK
Increased Uncertainty
in Forecasts
Forecast Expenditure by Decommissioning Component
Decommissioning expenditure is categorised according to the components referenced in the Work Breakdown
Structure (see section 3.1 on the survey methodology and the Appendix):
•
Operator project management/facility running costs (owners’ costs)
•
Well P&A
•
Removal and other associated activity
The components that incur expenditure are determined by the project size and type. A large and complex
decommissioning project, for example, may incur expenditure across all categories. Projects such as these will
involve significant overhead costs for project management and operations, as well as requiring substantial
engineering expertise, equipment and personnel. In contrast, decommissioning a small subsea tie-back may only
involve single well P&A.