


 54 / 74

DECOMMISSIONING INSIGHT REPORT
2016
54
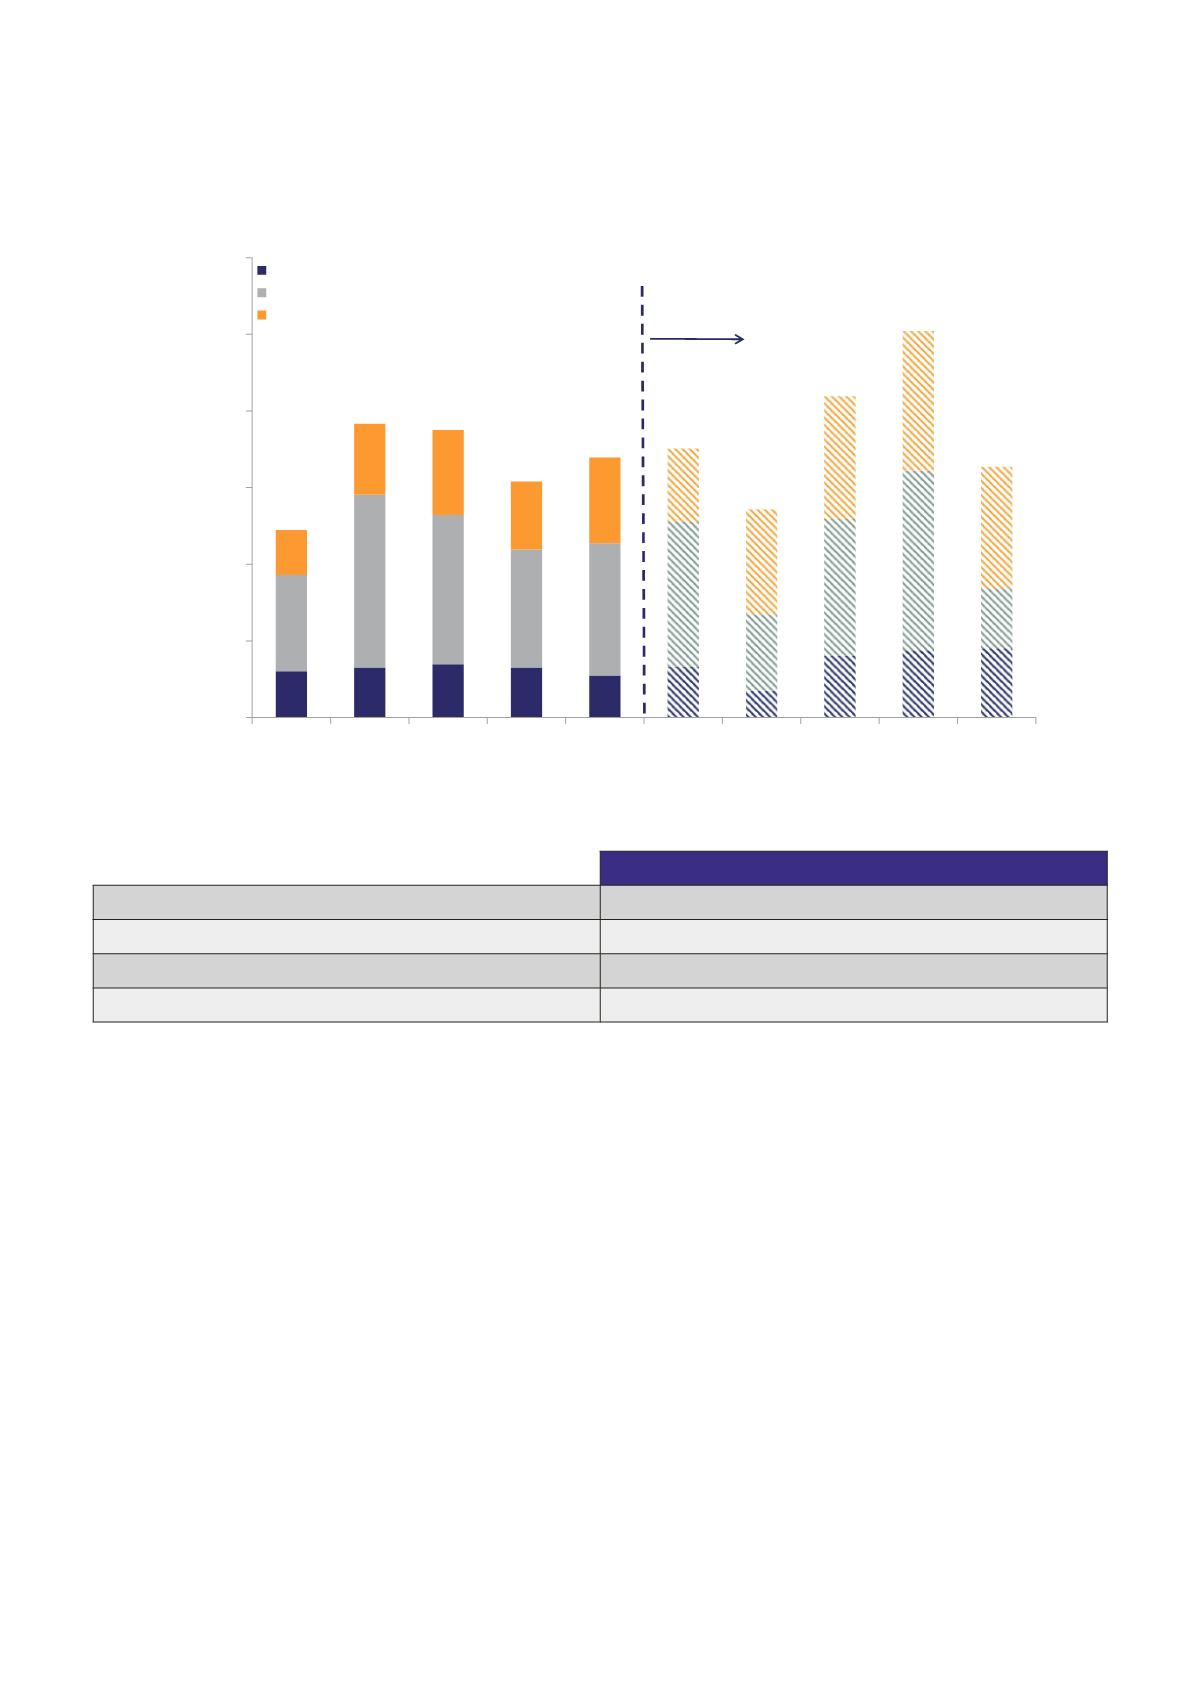
Figure 37: Total Forecast Decommissioning Expenditure on the UKCS by Work Breakdown Structure Category
0
500
1,000
1,500
2,000
2,500
3,000
2016 2017 2018 2019 2020 2021 2022 2023 2024 2025
Total Expenditure (£ Million - 2015 Money)
Operator Project Management and Facility Running Costs
Well P&A
Removals and Other Associated Activity
Source: Oil & Gas UK
Increased Uncertainty
in Forecasts
UKCS Expenditure 2016 to 2025
Owners’ costs
£3.4 billion
Well P&A
£8.3 billion
Removal
£3.4 billion
Other associated activity
£2.6 billion
In line with previous reports, well P&A remains the largest category of forecast expenditure, accounting for
47 per cent (£8.3 billion) of total forecast expenditure over the next ten years. Owners’ costs and expenditure
associated with topsides, substructure and subsea infrastructure removal each account for 19 per cent of total
forecast expenditure at £3.4 billion each. For subsea projects, well P&A accounts for 65 per cent of the total,
compared with 8 per cent for owners’ costs (£4 billion total expenditure on subsea projects).
Breaking this down further, of the £8.3 billion expenditure associated with well P&A, 57 per cent (£4.7 billion) is in
the central North Sea, an increase from the £4 billion forecast in 2015 due to the additional subsea wells included
that are more expensive to plug and abandon.
Ninety-seven per cent (£3.3 billion) of the total owners’ costs are concentrated in the central and northern North
Sea and west of Shetland. In these areas, platforms are typically manned resulting in much higher facility running
costs. Projects are also larger and more complex, with, in turn, higher operator project management costs. The
owners’ costs account for 31 per cent (£2.5 billion) of expenditure on platform removal projects in these areas
compared to four per cent (£118 million) in the southern North Sea and Irish Sea.