


 56 / 74

DECOMMISSIONING INSIGHT REPORT
2016
56
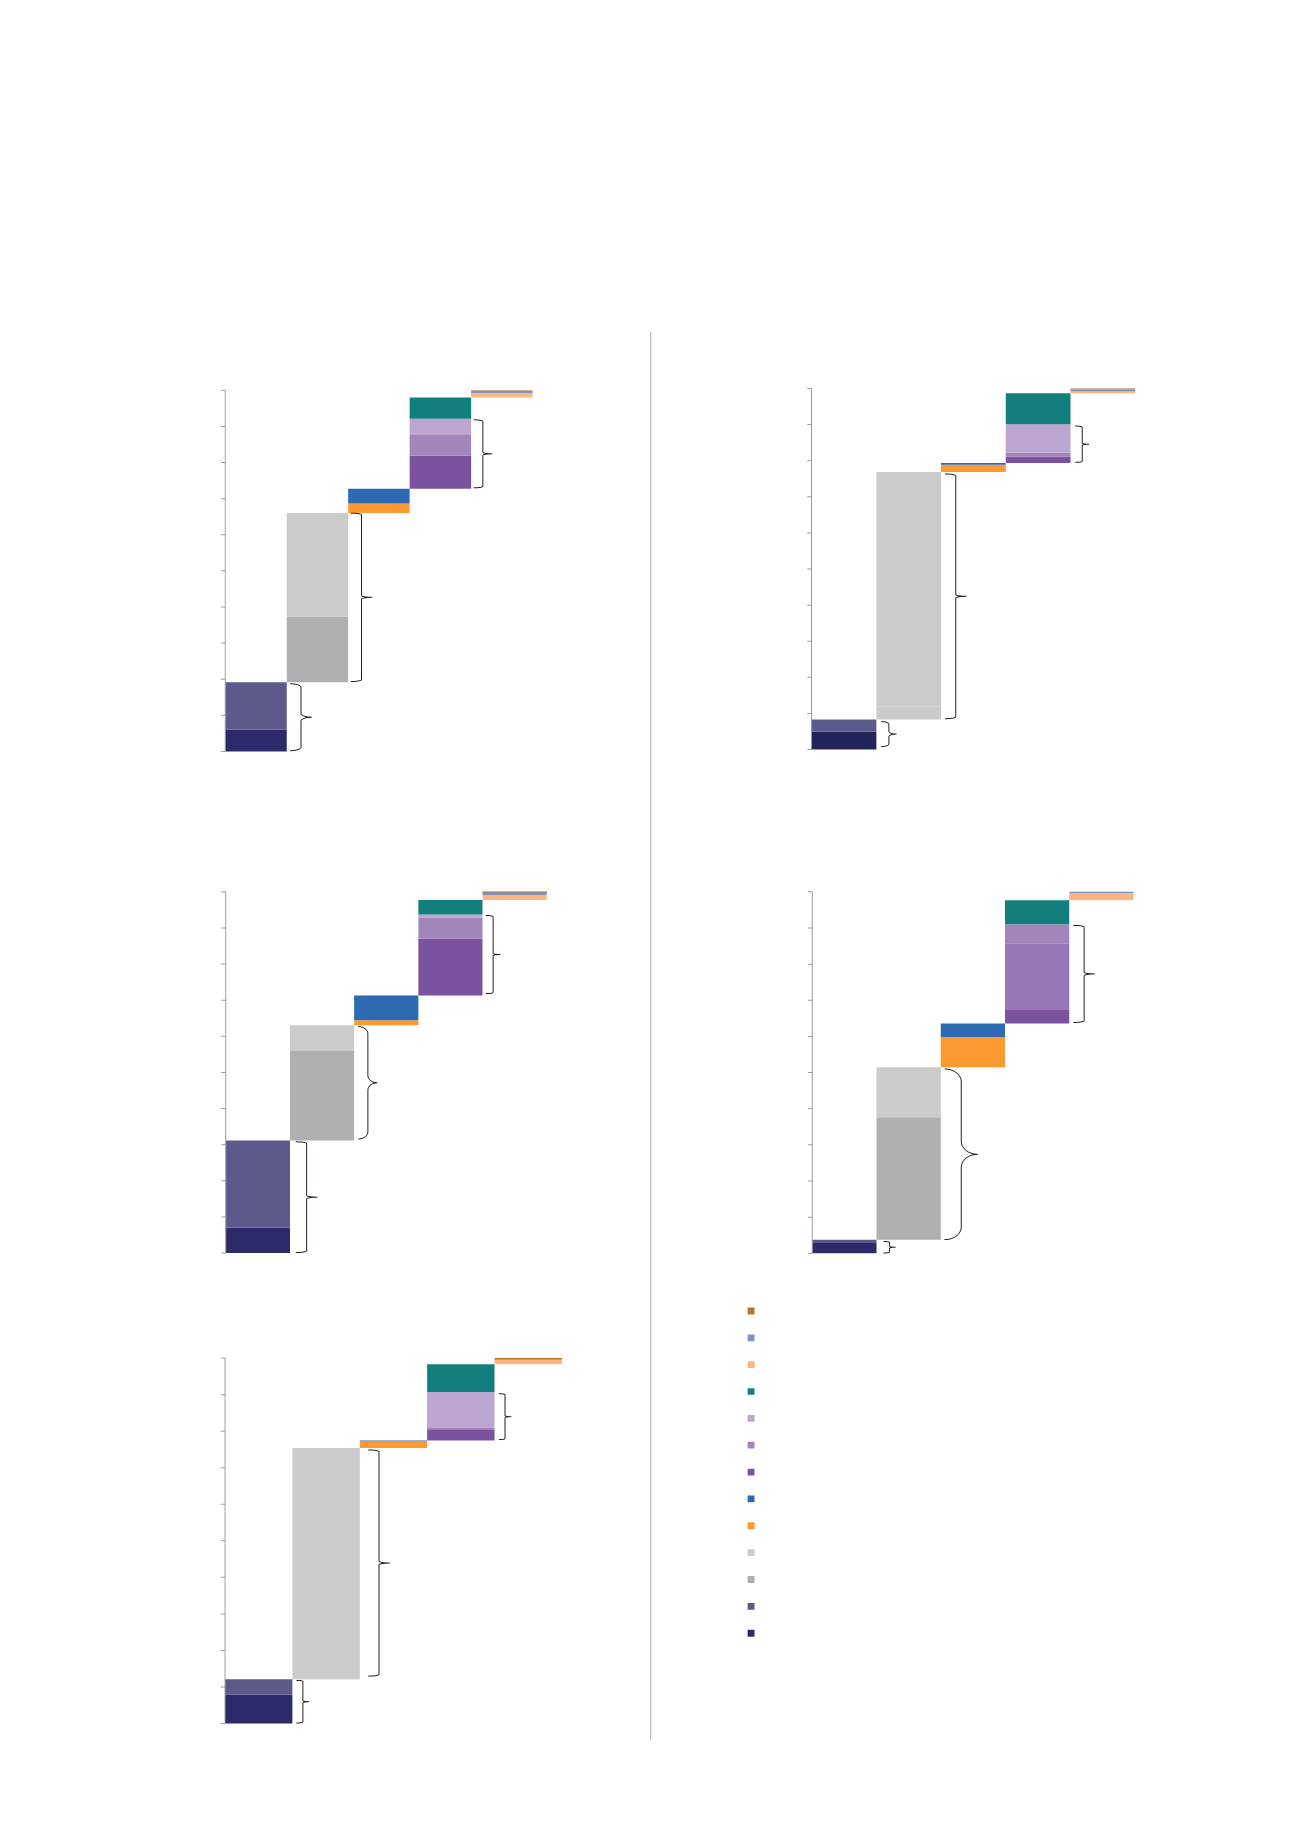
Figure 38: Total Forecast Decommissioning Expenditure on the UKCS by Work Breakdown Structure
Component and Project Type from 2016 to 2025
All UKCS Projects
0%
10%
20%
30%
40%
50%
60%
70%
80%
90%
100%
Proportion of Total Expenditure for Each Work
Breakdown Structure Component
Monitoring
Site Remediation
Topsides and Substructure
Onshore Recycling
Pipelines
Subsea Infrastructure
Substructure Removal
Topsides Removal
Topsides Preparation
Facility/Pipeline Making Safe
Subsea Wells
Platform Wells
Facility Running/Owner
Costs
Operator Project
Management
Owners' Costs: 19%
Well P&A: 47%
Removals*: 19%
Source:Oil&GasUK
*
I
ndicates expenditure
clearly identified as removal
CNS, NNS and W o S Platform Removal Projects
0%
10%
20%
30%
40%
50%
60%
70%
80%
90%
100%
Proportion of Total Expenditure for Each Work
Breakdown Structure Component
Monitoring
Site Remediation
Topsides and Substructure
Onshore Recycling
Pipelines
Subsea Infrastructure
Substructure Removal
Topsides Removal
Topsides Preparation
Facility/Pipeline Making Safe
Subsea Wells
Platform Wells
Facility Running/Owner
costs
Operator Project
Management
Owners' Costs: 31%
Well P&A: 32%
Removals*: 23%
Source:Oil&GasUK
*
I
ndicates expenditure
clearly identified as removal
FPSO Vessel Projects
0%
10%
20%
30%
40%
50%
60%
70%
80%
90%
100%
Proportion of Total Expenditure for Each Work
Breakdown Structure Component
Monitoring
Site Remediation
Topsides and Substructure
Onshore Recycling
Pipelines
Subsea Infrastructure
Substructure Removal
Topsides Removal
Topsides Preparation
Facility/Pipeline Making Safe
Subsea Wells
Platform Wells
Facility Running/Owner Costs
Operator Project
Management
Owners' Costs: 12%
Well P&A: 63%
Removals*: 13%
Source:Oil&GasUK
*
I
ndicates expenditure
clearly identified as removal
Subsea Projects
0%
10%
20%
30%
40%
50%
60%
70%
80%
90%
100%
Proportion of Total Expenditure for Each Work
Breakdown Structure Component
Owners' Costs: 8%
Well P&A: 69%
Removals*: 10%
Source:Oil&G
SNS and Irish Sea Platform Removal Projects
0%
10%
20%
30%
40%
50%
60%
70%
80%
90%
100%
Proportion of Total Expenditure for Each Work
Breakdown Structure Component
Monitoring
Site Remediation
Topsides and Substr
Onshore Recycling
Pipelines
Subsea Infrastructu
Substructure Remo
Topsides Removal
Topsides Preparatio
Facility/Pipeline Ma
Safe
Subsea Wells
Platform Wells
Facility Running/Ow
Costs
Operator Project
Management
Owners' Costs: 4%
Well P&A: 48%
Removals*: 27%
Source:Oil
*
I
ndicates expenditure
clearly identified as re
0%
10%
20%
30%
40%
50%
60%
70%
80%
90%
100%
Proportion of Total Expenditure for Each Work
Breakdown Structure Component
Monitoring
Site Remediation
Topsides and Substructure
Onshore Recycling
Pipelines
Subsea Infrastructure
Substructure Removal
Topsides Removal
Topsides Preparation
Facility/Pipeline Making Safe
Subsea Wells
Platform Wells
Facility Running/Owner Costs
Operator Project
Management
Owners' Costs: 12%
Well P&A: 63%
Removals*: 13%
Source:Oil & Gas UK
*
I
ndicates expenditure
clearly identified as removal