


 58 / 74

DECOMMISSIONING INSIGHT REPORT
2016
58
With the exception of one suspended subsea E&A well in the Norwegian Sea, all of the decommissioning activity
over the next decade is located in the Norwegian North Sea region. As illustrated in Figure 39, the proportion of
forecast expenditure attributed to each Work Breakdown Structure component varies significantly across the
10 out of 14 platform removal projects that provided data.
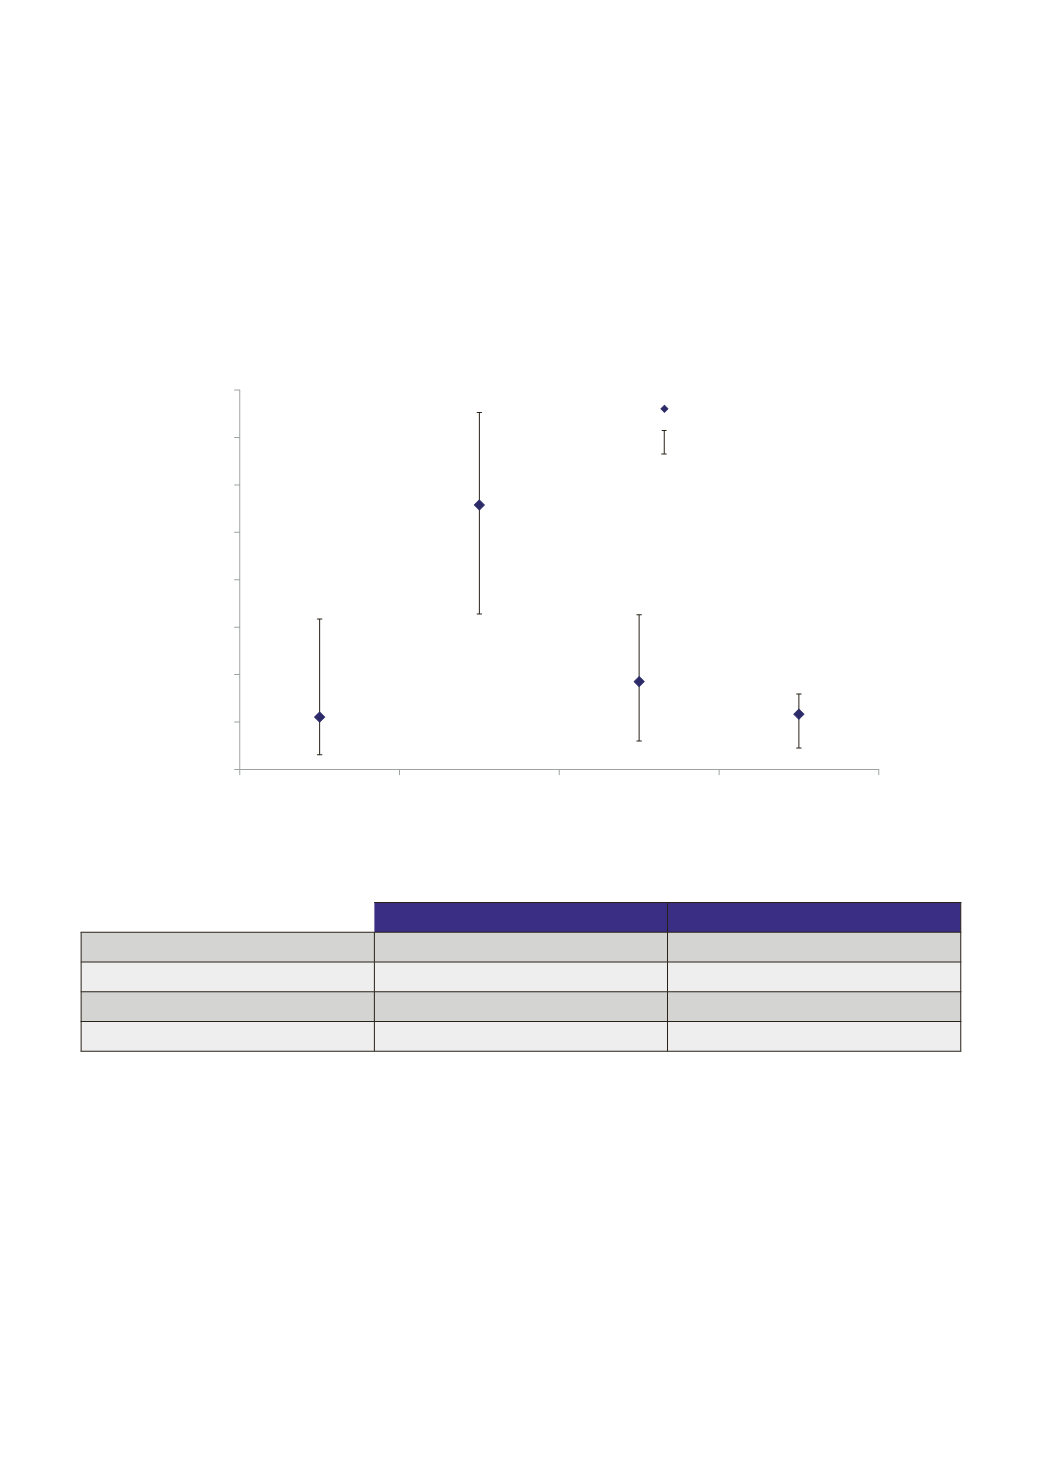
Figure 39: Total Forecast Decommissioning Expenditure on the Norwegian Continental Shelf
by Work Breakdown Structure Component for Platform Removal Projects
0%
10%
20%
30%
40%
50%
60%
70%
80%
Owners' Costs
Well P&A
Topside Removal
Substructure Removal
Proportion of Total Expenditure per Work Breakdown
Structure Category
Average Forecast Cost
Range in Cost Forecasts
Source: Oil & Gas UK
Average
Range
Owners' costs
11%
3-32%
Well P&A
56%
33-75%
Topside removal
19%
6-33%
Substructure removal
12%
5-16%