


 61 / 74

61
Southern North Sea and Irish Sea
•
The average forecast cost per well P&A in these regions has fallen to £2 million per platform well,
£5.6 million per suspended E&A well and £7.6 million per subsea development well. The reason for
the decrease is two fold: wells included in both survey years are expected to be cheaper to perform
than they were a year ago and the new wells included in the survey have cost forecasts at the low end.
•
Operators have indicated that reduced well P&A durations and lower rig rates have contributed to the reduction
in forecast unit costs. Well P&A durations have reduced over the course of ongoing campaigns, reflected in
lower cost estimates for future wells.
•
Day-rates for jack-up rigs have fallen by over 40 per cent over the last year – the lower rig rates are likely to be
reflected in the cost estimates as 64 per cent of platform wells and 70 per cent of subsea wells in these regions
plan to use a jack-up rig for well P&A.
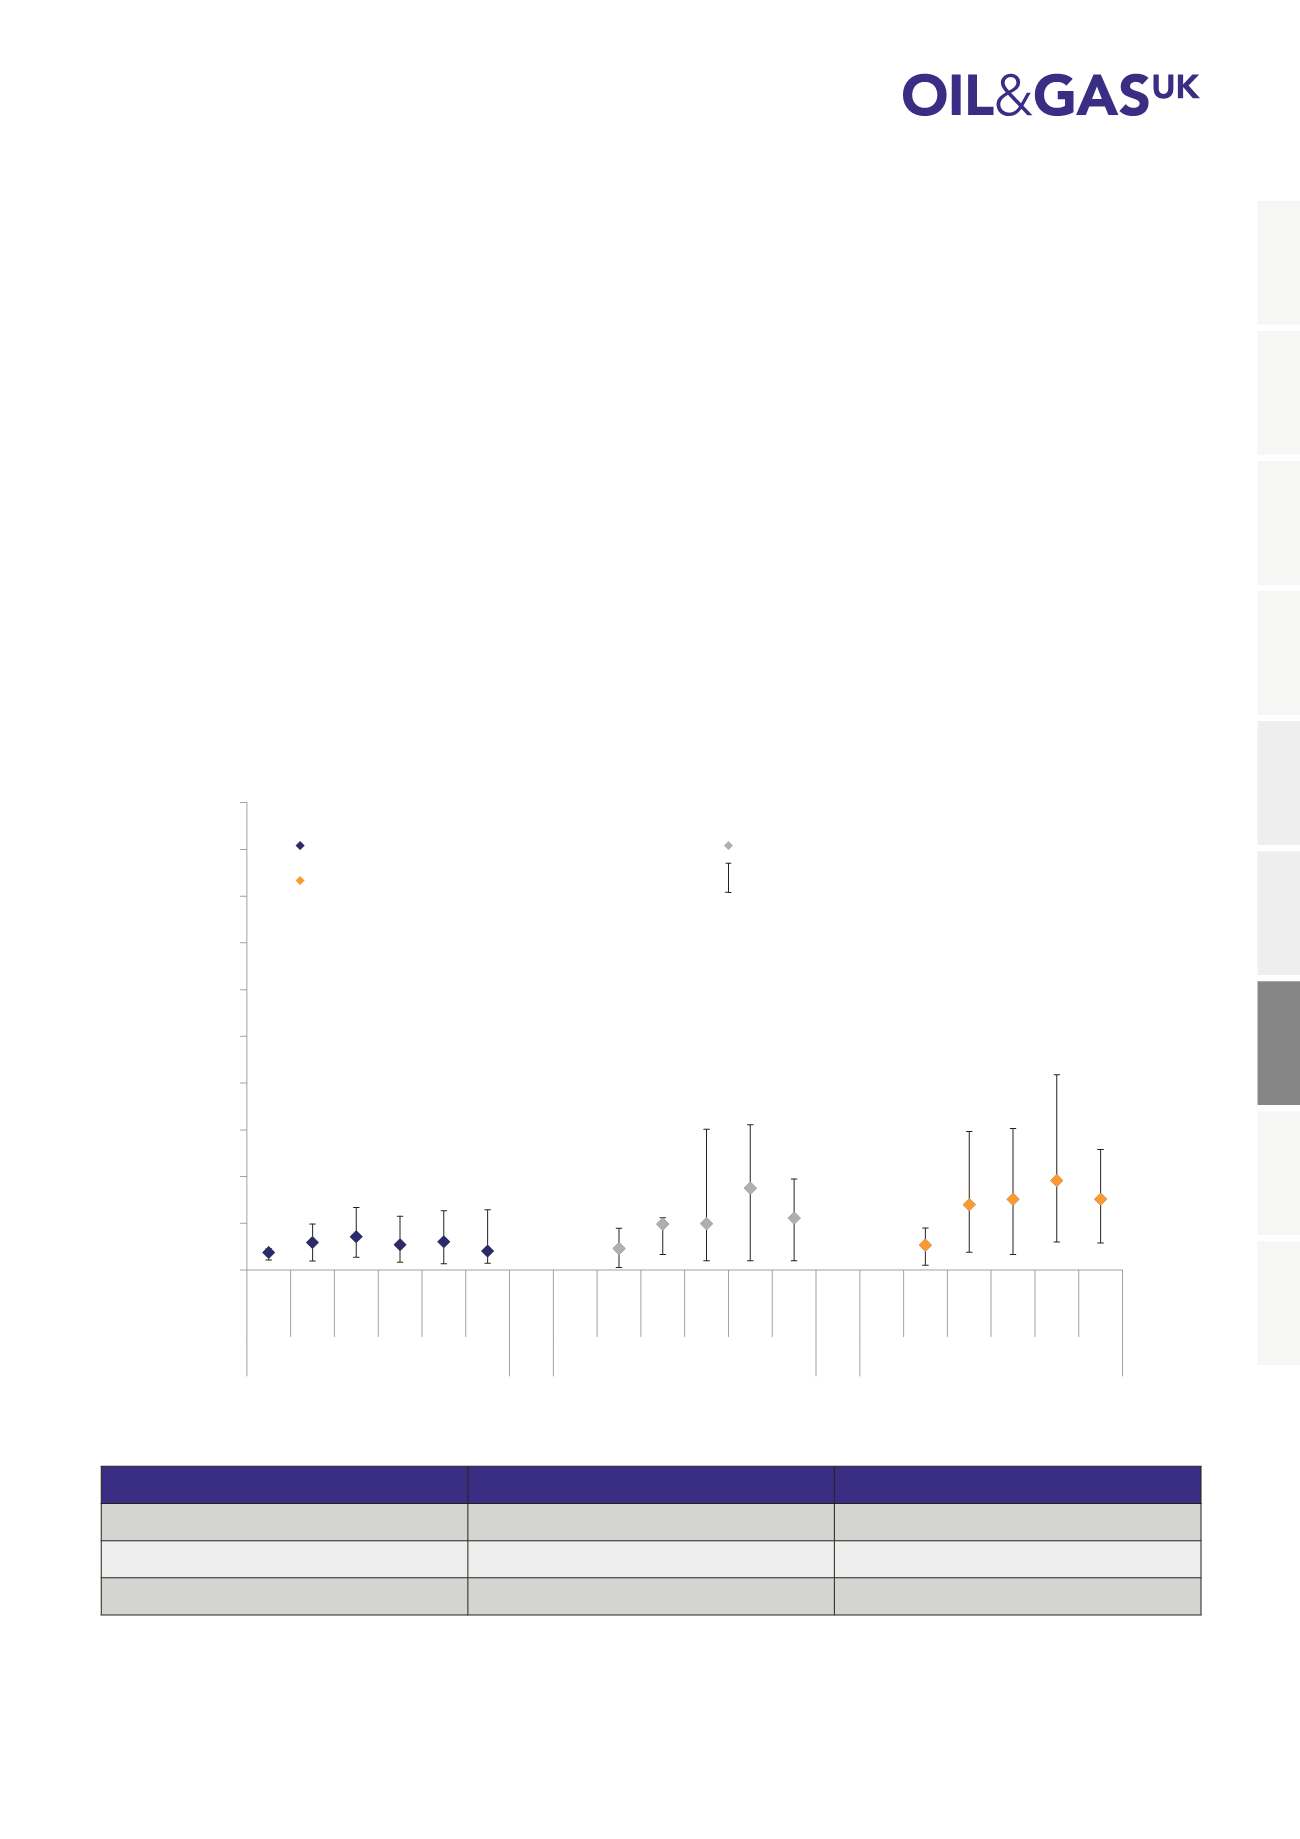
Figure 41: Historical Variation in Well Plugging and Abandonment Cost Forecasts
in the Southern North Sea and Irish Sea
0
5
10
15
20
25
30
35
40
45
50
2011
2012
2013
2014
2015
2016
2011*
2012
2013
2014
2015
2016
2011*
2012
2013
2014
2015
2016
Platform Wells
Suspended E&A Wells
Subsea Development Wells
Estimated Cost per Well (£ Million - 2015 Money)
Average Forecast Cost Platform Well
Average Forecast Cost Suspended E&A Well
Average Forecast Cost Subsea Development Well
Range in Cost Forecasts
Source: Oil & Gas UK
* Data cannot be split out for subsea E&A and development wells for 2011
Well P&A
2015 Survey Average
2016 Survey Average
Platform wells
£3 million
£2 million
Suspended E&A wells
£8.8 million
£5.6 million
Subsea development wells
£9.6 million
£7.6 million
1
2
3
4
5
6
7
8
9