


 7 / 708

5
Morningstar FundInvestor
January
2016
Data through December 31, 2015 FINRA members: For internal or institutional use only.
Artisan Global Value Investor
Ticker
ARTGX
Yield
0.3%
Total Assets
$1,576 mil
Mstar Category
World Stock
Benchmark 1:
MSCI ACWI NR USD
Benchmark 2:
MSCI ACWI Ex USA NR USD
Morningstar Analyst Rating
01-05-16
„
Morningstar Pillars
Process
∞
Positive
Performance
∞
Positive
People
∞
Positive
Parent
∞
Positive
Price
§
Negative
Morningstar Analyst Rating
Morningstar evaluates mutual funds based on five key pillars, which its
analysts believe lead to funds that are more likely to outperform over the
long term on a risk-adjusted basis.
Analyst Rating Spectrum
Œ „ ´ ‰ Á
Pillar Spectrum
∞
Positive
§
Negative
¶
Neutral
10.0
12.5
15.0
17.5
7.5
5.0
Historical Profile
Return
Risk
Rating
High
Below Avg
QQQQQ
Highest
4 4 4 7 4 7 4 1
Investment Style
Equity
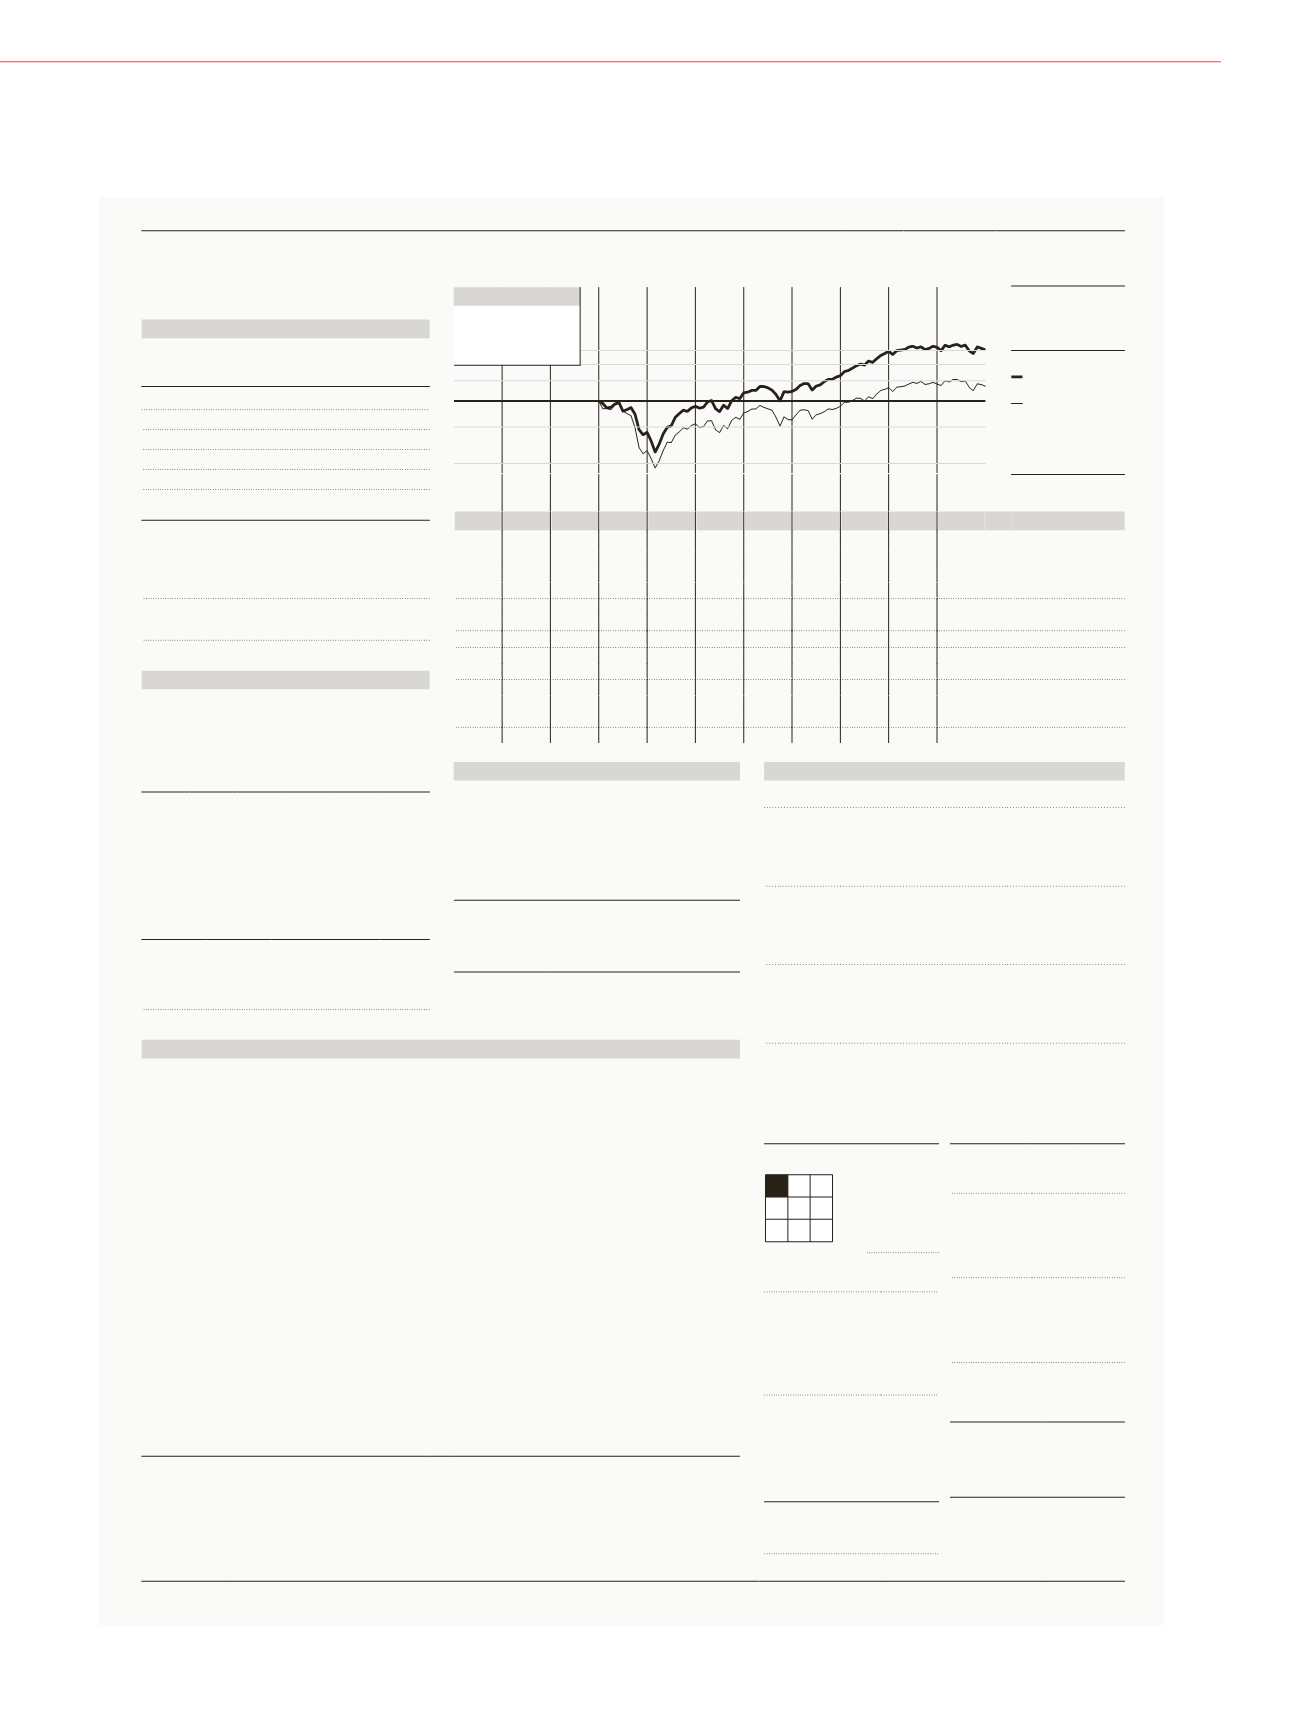
Growth of $10,000
Investment Values of
Fund
Investment Values of
Benchmark 1
& * * & * & * (
Performance Quartile
(within Category)
2005 2006 2007 2008 2009 2010 2011 2012 2013 2014 12-15
History
. .
9.63 6.76 8.81 10.16 10.14 11.97 15.34 15.51 14.24
NAV
. . .
-29.26 33.37 16.18 1.50 18.98 31.12 4.50 -2.87
Total Return %
. . .
12.94 -1.26 3.51 8.84 2.85 8.32 0.34 -0.51
+/- Bmark 1
. . .
16.27 -8.08 5.02 15.20 2.15 15.83 8.37 2.79
+/- Bmark 2
. . .
0.55 3.01 0.85 0.00 0.61 0.72 0.51 0.33
Income Return %
. . .
-29.81 30.36 15.33 1.50 18.36 30.40 3.99 -3.20
Capital Return %
. . .
6
46
26
9
27
16
29
68
Total Rtn % Rank Cat
. . .
0.05 0.20 0.08 0.00 0.06 0.09 0.08 0.05
Income $
. . .
0.00 0.00 0.00 0.17 0.03 0.26 0.44 0.80
Capital Gains $
. . .
3.53 1.50 1.96 1.72 1.51 1.37 1.30 1.28
Expense Ratio %
. . .
1.39 1.11 0.71 0.56 0.50 0.45 0.59 0.46
Income Ratio %
. . .
42
57
35
32
22
31
25
19
Turnover Rate %
. . .
17
31
43
91
239 1,064 1,303
.
Net Assets $mil
Performance
12-31-15
1st Qtr
2nd Qtr
3rd Qtr
4th Qtr
Total
2011
2.56 2.98 -13.51 11.12 1.50
2012
9.17 -2.80 7.62 4.18 18.98
2013
8.77 3.46 7.20 8.69 31.12
2014
1.30 4.31 -3.58 2.56 4.50
2015
0.52 0.45 -7.60 4.11 -2.87
Trailing
Total
Return%
+/- Bmark
1
+/- Bmark
2
%Rank
Cat
Growth of
$10,000
3 Mo
4.11 -0.92 0.86
53 10,411
6 Mo
-3.80 1.10 5.52
33 9,620
1 Yr
-2.87 -0.51 2.79
68 9,713
3 Yr Avg
10.00 2.31 8.50
24 13,309
5 Yr Avg
9.95 3.86 8.89
5 16,071
10 Yr Avg
— — — — —
15 Yr Avg
— — — — —
Tax Analysis
Tax Adj Rtn% %Rank Cat Tax-Cost Rat %Rank Cat
3 Yr (estimated)
8.75
21
1.14
45
5 Yr (estimated)
9.09
4
0.78
41
10 Yr (estimated)
— — — —
Potential Capital Gain Exposure: 6% of assets
Rating and Risk
Time
Period
Load-Adj
Return %
Morningstar
Rtn vs Cat
Morningstar
Risk vs Cat
Morningstar
Risk-Adj Rating
1 Yr
-2.87
3 Yr
10.00
+Avg
-Avg
QQQQ
5 Yr
9.95
High
-Avg
QQQQQ
10 Yr
— — — —
Incept
6.78
Other Measures
Standard Index
Best Fit Index
Alpha
8.4
-4.0
Beta
0.75
0.96
R-Squared
77
94
Standard Deviation
10.54
Mean
10.00
Sharpe Ratio
0.95
Portfolio Analysis
09-30-15
Total Stocks: 47
Share change since 06-30-15
Sector
Country
% Assets
Y
Oracle Corporation
Technology United States
4.83
Y
Bank of New York Mellon C
Finan Svcs United States
4.22
Y
Royal Bank of Scotland Gr
Finan Svcs United Kingdom 4.01
Y
Arch Capital Group Ltd
Finan Svcs United States
3.99
Y
Citigroup Inc
Finan Svcs United States
3.62
Y
Microsoft Corp
Technology United States
3.49
T
Johnson & Johnson
Hlth Care United States
3.30
Y
Medtronic PLC
Hlth Care United States
3.15
T
Samsung Electronics Co Lt
Technology South Korea
3.09
T
Tesco PLC
Cnsmr Def
United Kingdom 3.09
Y
Chubb Corp
Finan Svcs United States
3.03
Y
Cisco Systems Inc
Technology United States
3.02
Y
Qualcomm Inc
Technology United States
2.96
Y
Marsh & McLennan Companie Finan Svcs United States
2.82
T
ABB Ltd
Industrl
Switzerland
2.71
T
UBS Group AG
Finan Svcs Switzerland
2.61
Y
ISS A/S
Industrl
Denmark
2.54
Y
American Express Co
Finan Svcs United States
2.16
Y
ING Groep N.V.
Finan Svcs Netherlands
2.12
Y
Progressive Corp
Finan Svcs United States
1.97
Current Investment Style
Large Mid Small
Value Blend Growth
Market Cap %
Giant
58.8
Large 28.9
Mid
11.7
Small
0.7
Micro
0.0
Avg $mil:
44,637
Value Measures
Rel Category
Price/Earnings 14.25
0.80
Price/Book
1.46
0.64
Price/Sales
1.36
0.88
Price/Cash Flow 7.70
0.88
Dividend Yield % 2.33
0.88
Growth Measures
% Rel Category
Long-Term Erngs 10.78
0.99
Book Value
3.22
0.83
Sales
0.08
0.12
Cash Flow
-6.60
-4.64
Historical Erngs 2.23
0.68
Composition - Net
Cash
8.0 Bonds
0.0
Stocks 92.0 Other
0.0
Foreign
(% of Stock)
42.6
Sector
Weightings
% of
Stocks
Rel
Bmark 1
h
Cyclical
43.67 1.14
r
BasicMat
0.00 0.00
t
CnsmrCyc
3.21 0.27
y
FinanSvcs
40.46 2.15
u
Real Est
0.00 0.00
j
Sensitive
38.89 1.09
i
CommSrvs
2.07 0.42
o
Energy
3.07 0.50
p
Industrl
8.39 0.82
a
Technlgy
25.36 1.78
k
Defensive
17.45 0.67
s
CnsmrDef
8.79 0.86
d
Hlthcare
8.66 0.68
f
Utilities
0.00 0.00
Regional Exposure
% Stock
UK/W. Europe 32 N. America 59
Japan
0 Latn America 2
Asia X Japan 7 Other
0
Country Exposure
% Stock
United States 57
UK
14
Switzerland 8
South Korea 5
Denmark
5
Morningstar's Take
by Greg Carlson 01-05-16
The recently reopened Artisan Global Value finally had an
off year, but its substantial virtues remain intact. Thus, it
continues to earn a Morningstar Analyst Rating of Silver.
The fund finished 2015 in the world stock Morningstar
Category’s 68th percentile and 2.9% behind its MSCI
ACWI benchmark as picks such as U.S. software maker
Oracle ORCL, Royal Bank of Scotland RBS, U.K. grocer
Tesco TSCO, and telecom chipmaker Qualcomm QCOM
all posted double-digit losses for the year. It’s not
surprising that the fund’s returns cooled off; it had never
trailed its typical peer in a calendar year since its 2007
inception, a period that encompassed years with strong
gains, modest losses, and a more substantial downturn.
The managers had trouble finding attractively valued
companies in recent years, thus cash had risen to double
digits. That changed in 2015’s third-quarter downturn,
when they began to find more compelling ideas and cash
dipped below 8% of assets. This shift, coupled with
modest net redemptions, prompted the managers to
reopen the fund in October 2015 to new investors for the
first time since 2013. (That move didn’t result in net
inflows to the fund in either October or November.) The
managers runatotalof$14.5billion inthisstrategy.While
their other charge, Artisan International Value ARTKX,
remains closed, that strategy has a larger asset base and
the portfolio includes fewer large, very liquid stocks than
this one.
The fund typically shines brightest in tough times and
in up-and-down markets due to the managers’ emphasis
on firms with steadier revenues and relatively solid
balance sheets. However, as economically sensitive fare
has latelyunderperformed, it'sbegun tomake itsway into
the portfolio. Thus, financial firms such as Citigroup C and
Royal Bank of Scotland are now among the fund’s largest
holdings.
The nature of these recent additions may cause
volatility--which has been low relative to peers--to rise a
bit in the future. But the fund's virtues remain. Samra and
O'Keefe are accomplished, disciplined investors who
invest substantially in the fund. It’s an excellent long-term
holding.
Address:
Artisan Funds Inc
Minimum Purchase:
$1000
Add: — IRA: —
Milwaukee, WI 53202
Min Auto Inv Plan:
$1000
Add: $50
800-344-1770
Sales Fees:
No-load, 2.00%R
Web Address:
www.artisanfunds.comManagement Fee:
1.00% mx./0.90% mn.
Inception:
12-10-07
Actual Fees:
Mgt:0.99% Dist:—
Advisor:
Artisan Partners Limited Partnership
Expense Projections:
3Yr:$418 5Yr:$724 10Yr:$1591
Subadvisor:
None
Income Distribution:
Annually
©2016Morningstar, Inc.All rights reserved. The information herein is not represented orwarranted to be accurate, complete or timely. Past
performance is no guarantee of future results.Access updated reports at
www.morningstar.com. To order reprints, call 312-696-6100.
ß
®
Mutual Funds
A