


 8 / 35


Lacorn & Weiss.:
J
ournal of
AOAC I
nternational
V
ol.
98, N
o
. 5, 2015
1351
(
6
) Avoid direct sunlight during all incubations; covering the
microtiter plates is recommended.
(
7
) Red Chromogen Pro reaction should be carried out in the
dark.
(
8
) Each standard and sample should be analyzed in
duplicate.
(
9
) Use also gluten-free and gluten-containing (spiked)
samples as test controls.
(
b
)
ELISA testing
.
(
1
) Insert a sufficient number of wells into the microwell
holder for all standards and samples to be run in duplicate.
Record standard and sample positions.
(
2
) Add 50 µL of each standard solution or prepared sample,
G
(
b
), to separate wells in duplicate.
(
3
) Add 50 µL of diluted enzyme conjugate,
F
(
d
), mix gently
by shaking the plate manually, and incubate for 30 min at room
temperature (20–25°C/68–77°F).
(
4
) Pour the liquid out of the wells and tap the microwell
holder upside down vigorously (three times in a row) against
absorbent paper to ensure complete removal of liquid from the
wells. Fill all wells with 250 µL washing buffer
F
(
e
), and pour
out the liquid again. Repeat two more times.
(
5
) Add 100 µL Red Chromogen Pro (substrate/chromogen
solution; brown cap) to each well. Mix gently by shaking the
plate manually and incubate for 10 min at room temperature
(20–25°C/68–77°F) in the dark.
(
6
) Add 100 µL stop solution to each well. Mix gently by
shaking the plate manually and measure the absorbance at
450 nm against an air blank. Read within 10 min after addition
of stop solution.
I.
Calculation
Interpretation and Test Result Report)
(
a
)
Result calculation
.—Special software RIDA
®
SOFT Win
(Part. No. Z9999) is available and strongly recommended for
evaluation of the RIDASCREEN
®
product line. The calculation
should be done using a cubic spline function. Extrapolation is
not recommended. The prolamin concentration in an extracted
sample is read from the calibration curve and given as ng/mL.
To calculate the concentration of prolamins or gluten in a
sample, the following equations should be used.
(
1
)
Solid samples
Gluten, mg/kg = Gluten concentration in extract,
ng/mL × 500/1000
(
2
)
Liquid samples
Gluten, mg/L = Gluten concentration in extract,
ng/mL × 500/1000.
Alternatively, a second order polynomial curve fitting could
be used.
(
b
)
Result reporting
.—Results are reported in mg/kg for
solid samples or mg/L for liquid samples.
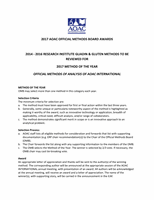
Table 1. Gluten concentrations determined by R5 competitive ELISA by all participating laboratories (raw data)
Gluten concentration, mg/kg
a
1
b
2
3
4
5
6
7
Repeat
Lab
1
2
1
2
1
2
1
2
1
2
1
2
1
2
A
2.13 5.80
23.6 20.5
111.6 93.9
4.47 7.73
7.60 8.62
46.7 47.2
152.9 170.0
B
1.46 2.66
40.8 13.8 151.4 127.4 2.98 2.13
10.6 5.10
38.8 53.0
163.6 122.8
C
5.30 10.6
34.2 82.2 192.2 107.6 6.12 1.90
12.8 12.6
47.2 67.4
181.4 143.4
D
0.74 1.77
23.8 28.6 175.2 97.6 –3.35 –3.41 9.80 11.0
33.0 60.2
106.4 107.6
E
6.45 20.4
72.4 50.4
24.6 204.0 23.5 17.6
20.4 29.4
68.6 72.8
251.0 244.2
F
–5.46 –3.99 14.6 27.0 124.0 160.0 –5.15 –5.55 9.20 6.80
47.0 51.4
128.8 151.6
G
6.06 4.30
32.4 32.0 216.2 208.2 3.29 –2.34 15.0 14.0
46.8 85.4
192.8 203.0
H
7.02 1.56
44.4 26.2 145.6 32.8
5.79 3.17
20.5 16.1
38.8 31.0
94.6 88.9
I
–0.65 –1.33 22.2 13.8 101.2 64.4
-0.89 –0.62 5.44 4.22
35.8 45.0
118.4 75.0
J
–1.50 1.14
21.2 20.0 121.8 128.8 –0.73 –1.63 7.40 8.00
45.6 58.3
132.9 139.2
K
16.3 14.8
50.0 44.8 216.7 308.6 21.1 9.70
33.5 22.4
87.5 80.0
348.0 30.2
L
1.69 –0.33 39.8 49.0 224.8 228.8 –1.83 3.39
13.2 11.6
64.0 67.2
171.6 244.6
M –0.66 4.13
19.9 19.3 129.4 133.6 –2.27 –0.62 10.0 8.60
36.1 39.6
161.7 120.4
N
0.04 0.76
34.2 18.4
97.0 108.6 1.84 4.41
10.8 9.20
43.4 44.6
117.6 154.4
O
1.57 0.41
19.1 16.5
110.7 136.6 –0.11 1.26
11.7 8.20
51.3 46.3
152.8 164.6
P
5.96 0.84
25.4 24.8 149.4 111.2
1.54 1.33
12.6 10.8
38.2 46.2 194.8 111.2
a
The calculation of the concentrations of the gluten-containing samples 2, 3, 5, 6, and 7 was done on the basis of a cubic spline function using the
RIDA
®
SOFT Win software; the statistics of the gluten-free samples 1 and 4 were calculated on the basis of a second-order polynomial function;
values for blinded samples are given as repeat 1 or repeat 2.
b
Sample 1, gluten-free beer; sample 2, beer spiked at 30 mg/kg; sample 3, beer spiked at 100 mg/kg; sample 4, gluten-free starch syrup; sample
5, naturally contaminated wheat starch syrup; sample 6, sourdough containing gluten at 70 mg/kg; and sample 7, sourdough containing gluten at
150 mg/kg.