


 5 / 56

Cushman & Wakefield of Florida, Inc.
/
5
0.0
5.0
10.0
15.0
20.0
25.0
2007
2008
2009
2010
2011
2012
2013
2014
2015
2016
2017
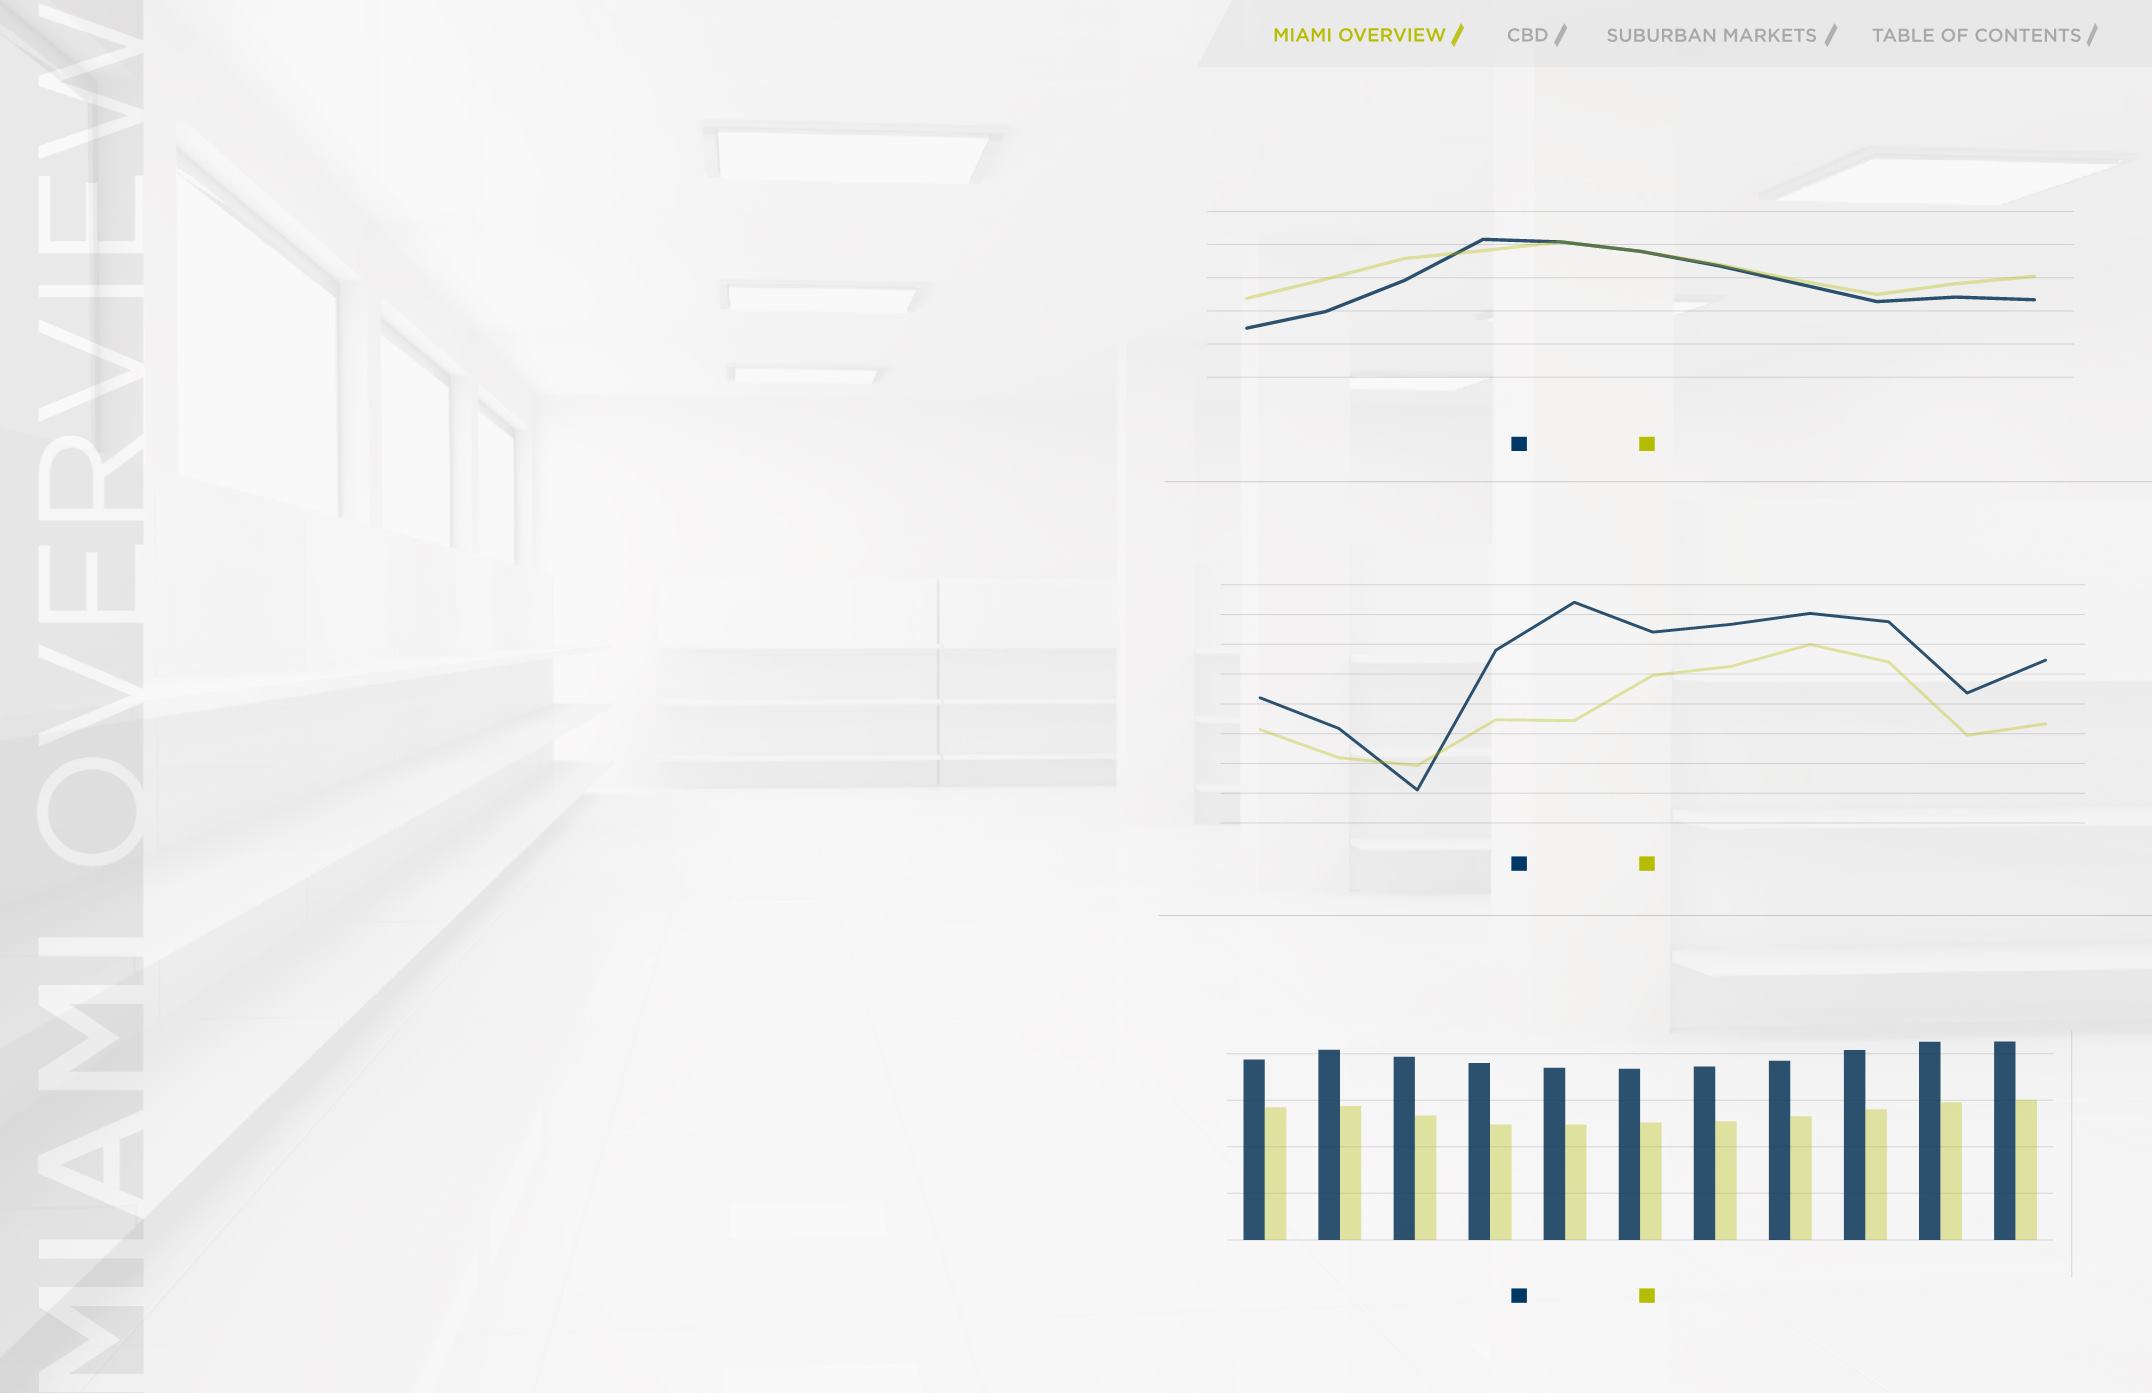
MIAMI - Direct Vacancy (%), 2007-3Q 2017
Class A Class B
Class A
Class B
Class A
Class B
Class A
Class B
SF
Percent
Quoted Rate PSF
MIAMI SUBLEASE
Physically vacant sublease still stood at insignificant levels of less than 1.0% of
total supply. During the depth of the Recession at midyear 2009, the volume of
vacant sublease spaces reached 589,000 SF. Third quarter available sublease (space
which was either vacant or occupied and may include later occupancy dates) was
significantly higher at 744,000 SF – most of which was Class A product. Only one
CBD Class A building and two in the Suburbs (Class A and Class B) were marketing
large subleases (at or in excess of 20,000 SF) at the close of the quarter.
DEMAND
HIGHLIGHTS
On the absorption front (which included new to market and expansion deals), the
first three quarters of positive absorption reversed last year’s lost occupancy of
137,000 SF. Class A buildings carried all of the new occupancy gains with a year-to-
date total of 294,000 SF. While at a reduced level, Class B buildings posted negative
absorption (-210,000 SF) in a continuation of 2016’s loss.
As for leasing activity (which included renewals along with new to market and
expansion transactions), the year-to-date volume exceeded 2.2 million SF.
Just over two-thirds of transactional activity occurred in Suburban markets.
SUBMARKET’S GAINING
OCCUPANCY
Unchanged over midyear, single-digit direct vacancies included Brickell’s Class A
sector in the CBD. Among Suburban submarkets, most were in the small waterfront
office sectors of Aventura, Coconut Grove and Miami Beach. Airport West’s Class
A buildings increased direct vacancy to 10.0% via new product delivery while Coral
Gables’ Class A sector posted a dramatic decline in direct vacancy – the first single
digit rate since 2007. At the end of the recession, all of Miami’s office submarkets had
double-digit vacancies.
PRICING
HIGHLIGHTS
Pricing for both classes of space continued their upward direction. During third
quarter, both classes of buildings reached decade-high annual averages. Quoted
peak averages for Class A assets exceeded $42.50 PSF while average direct quotes
for Class B buildings reached and topped the $30.00 PSF mark.
MIAMI TOTAL NET ABSORPTION, 2007-3Q 2017
MIAMI DIRECT VACANCY (%) 2007-3Q 2017
MIAMI AVERAGE DIRECT RENTAL RATES, 2007-3Q 2017
$0.00
$10.00
$20.00
$30.00
$40.00
$50.00
2007 2008 2009 2010 2011 2012 2013 2014 2015 2016 2017
MIAMI - Average Direct Rental Rates, 2007-2Q 2017
Class A Class B
-800,000
-600,000
-400,000
-200,000
0
200,000
400,000
600,000
800,000
2007
2008
2009
2010
2011
2012
2013
2014
2015
2016
2017
MIAMI - Total Net Absorption, 2007-3Q 2017
Class A Class B
SF
Class A buildings accounted for all of the last decade's new
occupancy gains - totaling 2.9 MSF