


 7 / 56

Cushman & Wakefield of Florida, Inc.
/
7
Class A
Class B
CBD
HIGHLIGHTS
CBD
HIGHLIGHTS
Most of Miami’s new inventory over the last decade was built in the CBD, increasing Class A stock
by 27.0%. The next delivery of new supply (318,000 SF) was expected by year-end 2017 in the
Downtown submarket. New occupancy gains since the 2010-2011 deliveries dramatically reduced the
record high annual average Class A vacancy rate of 24.0% by nearly 10.0 percentage points to the
current 14.3%. Leading CBD positive absorption levels, both year-to-date and in 2016, was Brickell’s
Class A segment. Among Class B buildings, negative absorption over the last seven quarters and
comparatively lower leasing volumes pushed vacancy to 19.5% - up from the 15.0% ranges posted
during 2014 and 2015.
Third quarter transactions were dominated by CBD backbone occupiers: Business Services, Financial
Services and Law Firms. The largest volume (66.0%) of CBD transactions on a square footage basis
were executed within the Downtown submarket where the largest leases (20,000+ SF) were also
signed.
CLASS A BUILDINGS
Dominating Tenants
31.0%
Class A Stock Increase 2007-2017
52,336 SF
YTD New Occupancy
24.2% 14.3%
Class A Vacancy rate
3.2MSF
80%
Legal
Financial & Legal
Financial & Legal
Down 9.9% Points from 2011-2017
CBD Class A users
Largest SF Footprint
Occupying 1,000 SF +
Class A
YTD
Completions
Under
Construction
Existing
Inventory SF
Direct
Vacancy %
Total
Vacancy %
YTD Net
Absorption
Average Direct
RR PSF Quoted
CBD Class A
0
318,000
9,459,383
14.3% 15.1% 52,336
$47.01
CBD Class B
0
0
3,854,878
19.5% 20.0% -57,579
$31.06
Totals
0
318,000 13,314,261
15.8% 16.6% -5,243
$41.22
Percent
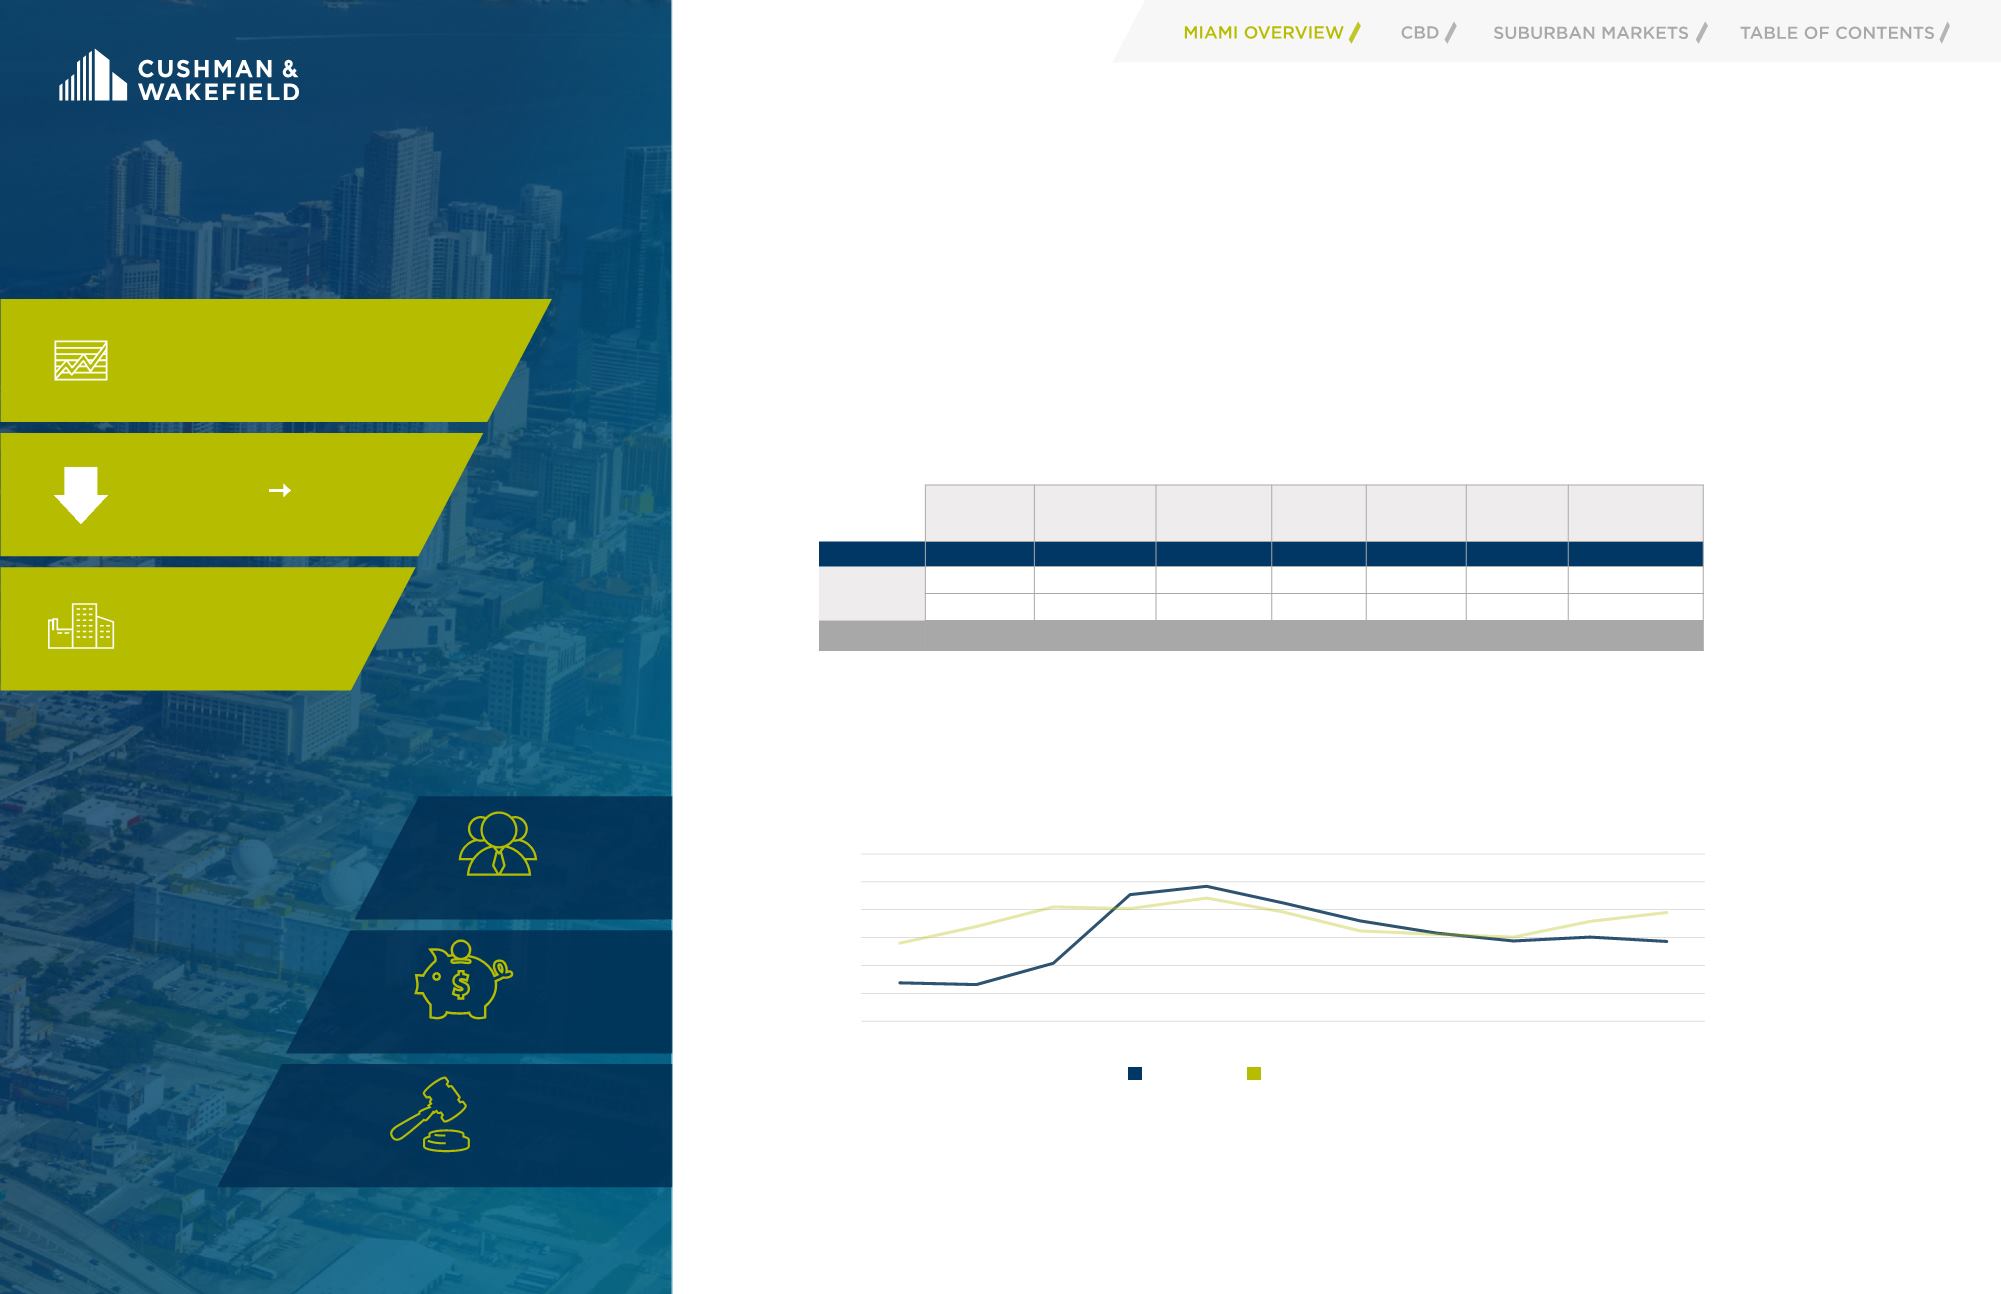
CBD - DIRECT VACANCY (%) 2007-3Q 2017
0.0
5.0
10.0
15.0
20.0
25.0
30.0
2007
2008
2009
2010
2011
2012
2013
2014
2015
2016
2017
CBD Direct Vacancy (%), 2007-3Q 2017
Class A Class B
Perc nt