


 58-59 / 156


33
Comments to expenditures 2008 and 2009 in table 4:
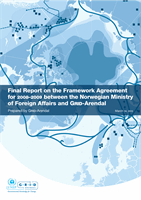
Figure 4
Revenue distribution:
The activity level in 2009 increased significantly with
MNOK 13,8 compared to 2008. The total revenues in
2009 were MNOK 56,7 and the increased revenues were
covered by a corresponding increase in fundraising 2009
up to MNOK 57,1.
Net sales in Marine area increased with MNOK 6,5. This
capacity was higher in 2009 with 2 more employees and 1
staff returned from maternity leave 2009. Also significant
more use of consultants and more income from
workshops and travels. The Marine Programme received
additional contribution from MoFa and used funding
carried over from 2008.
Regional Fields revenues increased with MNOK 7 in total
costs, more than half of this is related to direct costs for
Environment & Security activities, FK Youth exchange
programme and a significant increase in number of
publications.
Revenue from the Polar Programme has been rather
stable and the activities in 2009 continued as in 2008
without having the new Head of Polar manager in place.
Breakdown of actual revenue:
Consultancy revenue is generated from time bookings
employees and fixed consultants with markup to cover
overhead costs and profit. With MNOK 39,8 this equals
70% of total GRID Revenue 2009. In 2009 costs for fixed
consultants was MNOK 3,9 higher than 2008.
Revenue from Subcontractors, Travel-, IT-and other
expenses is generated from costs of sales on projects
plus 13% mark-up. In 2008 there were no mark-up on
travel costs to cover overhead costs.
Figure 5