


 12 / 58

DECOMMISSIONING INSIGHT
2015
page 12
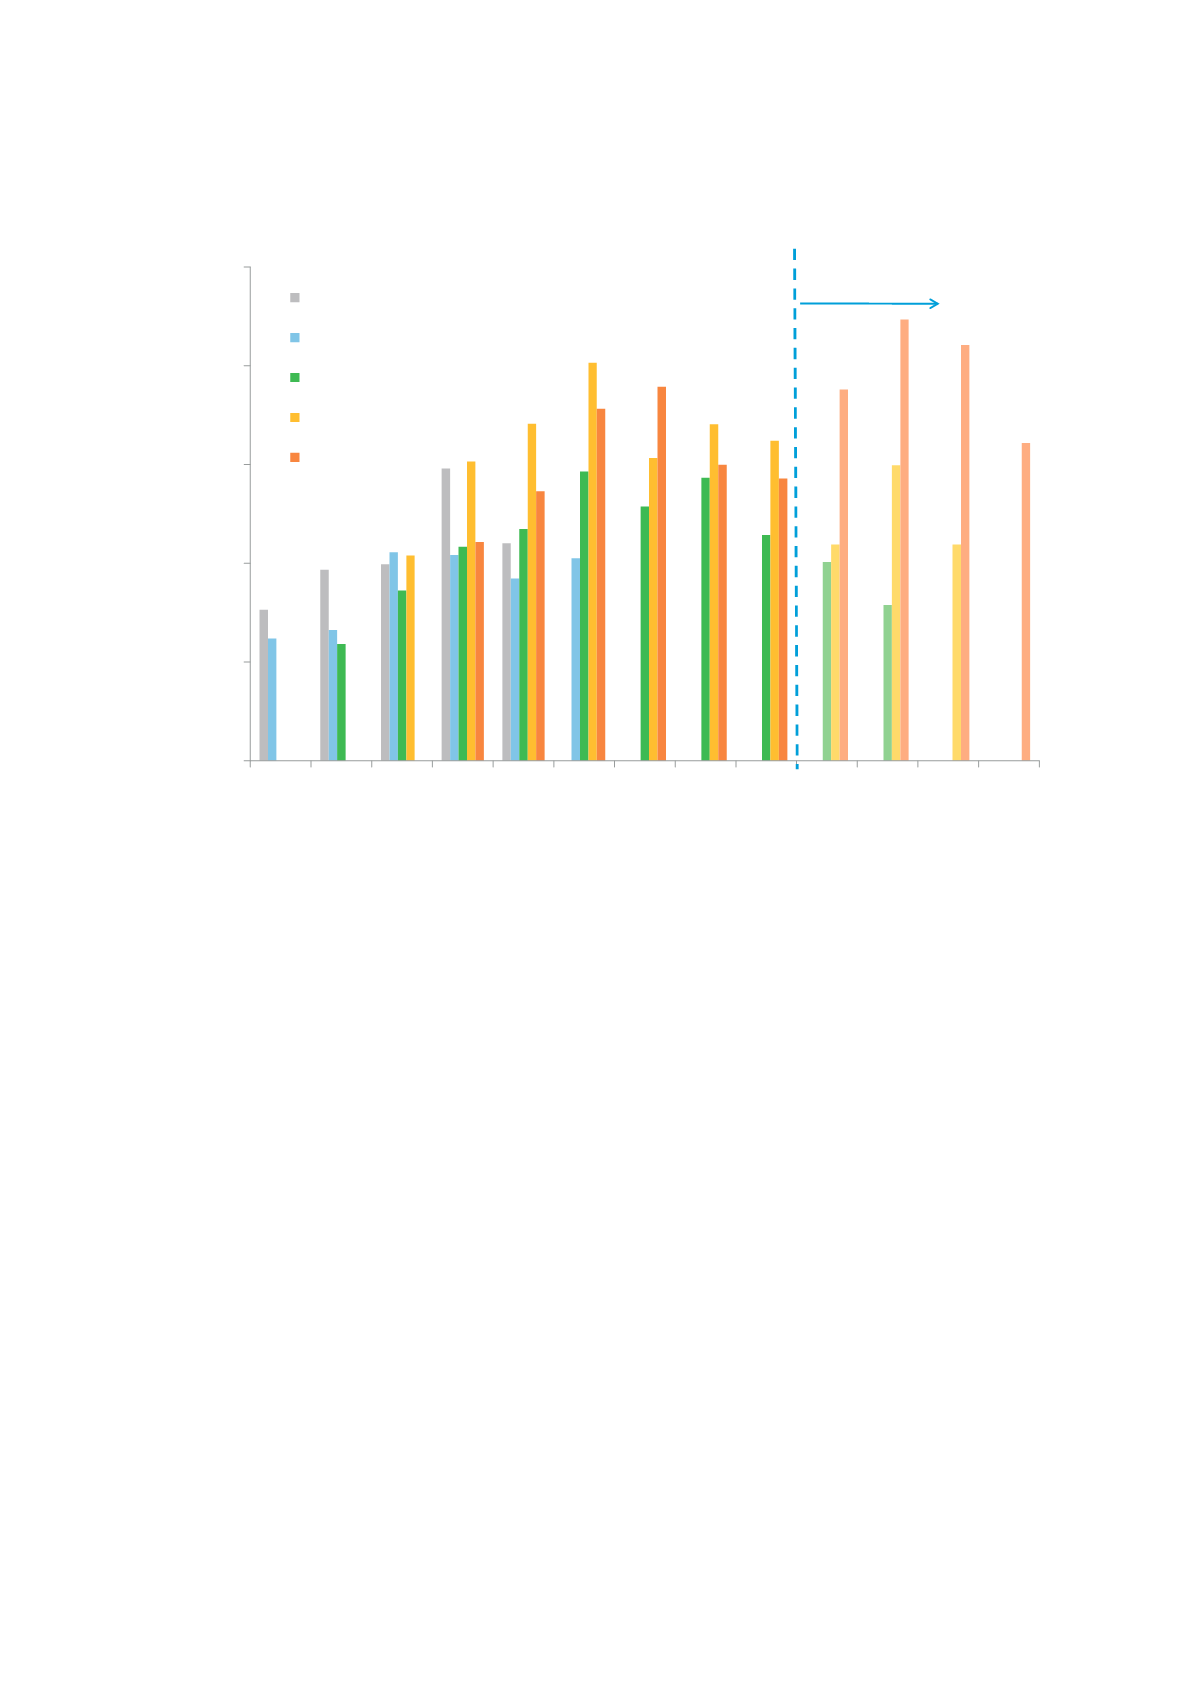
Figure 2: Comparison of the Annual Forecast Decommissioning Expenditure
0
500
1,000
1,500
2,000
2,500
2012 2013 2014 2015 2016 2017 2018 2019 2020 2021 2022 2023 2024
Forecast Expenditure (£ Million - 2015 Money)
2011
2012
2013
2014
2015
Increased Uncertainty
in Forecasts
Source: Oil & Gas UK
4.2 Regional Breakdown
Looking at the regional breakdown of decommissioning expenditure from 2015 to 2024, 50 per cent (£8.4 billion)
is forecast to be spent in the central North Sea (CNS) and 34 per cent (£5.7 billion) in the northern North Sea (NNS)
and west of Shetland (WofS). The higher proportion of expenditure in these regions reflects the number, size and
degree of complexity of the projects. Sixteen per cent (£2.8 billion) is, meanwhile, forecast to be spent in the
southern North Sea (SNS) and Irish Sea.