


 3 / 123

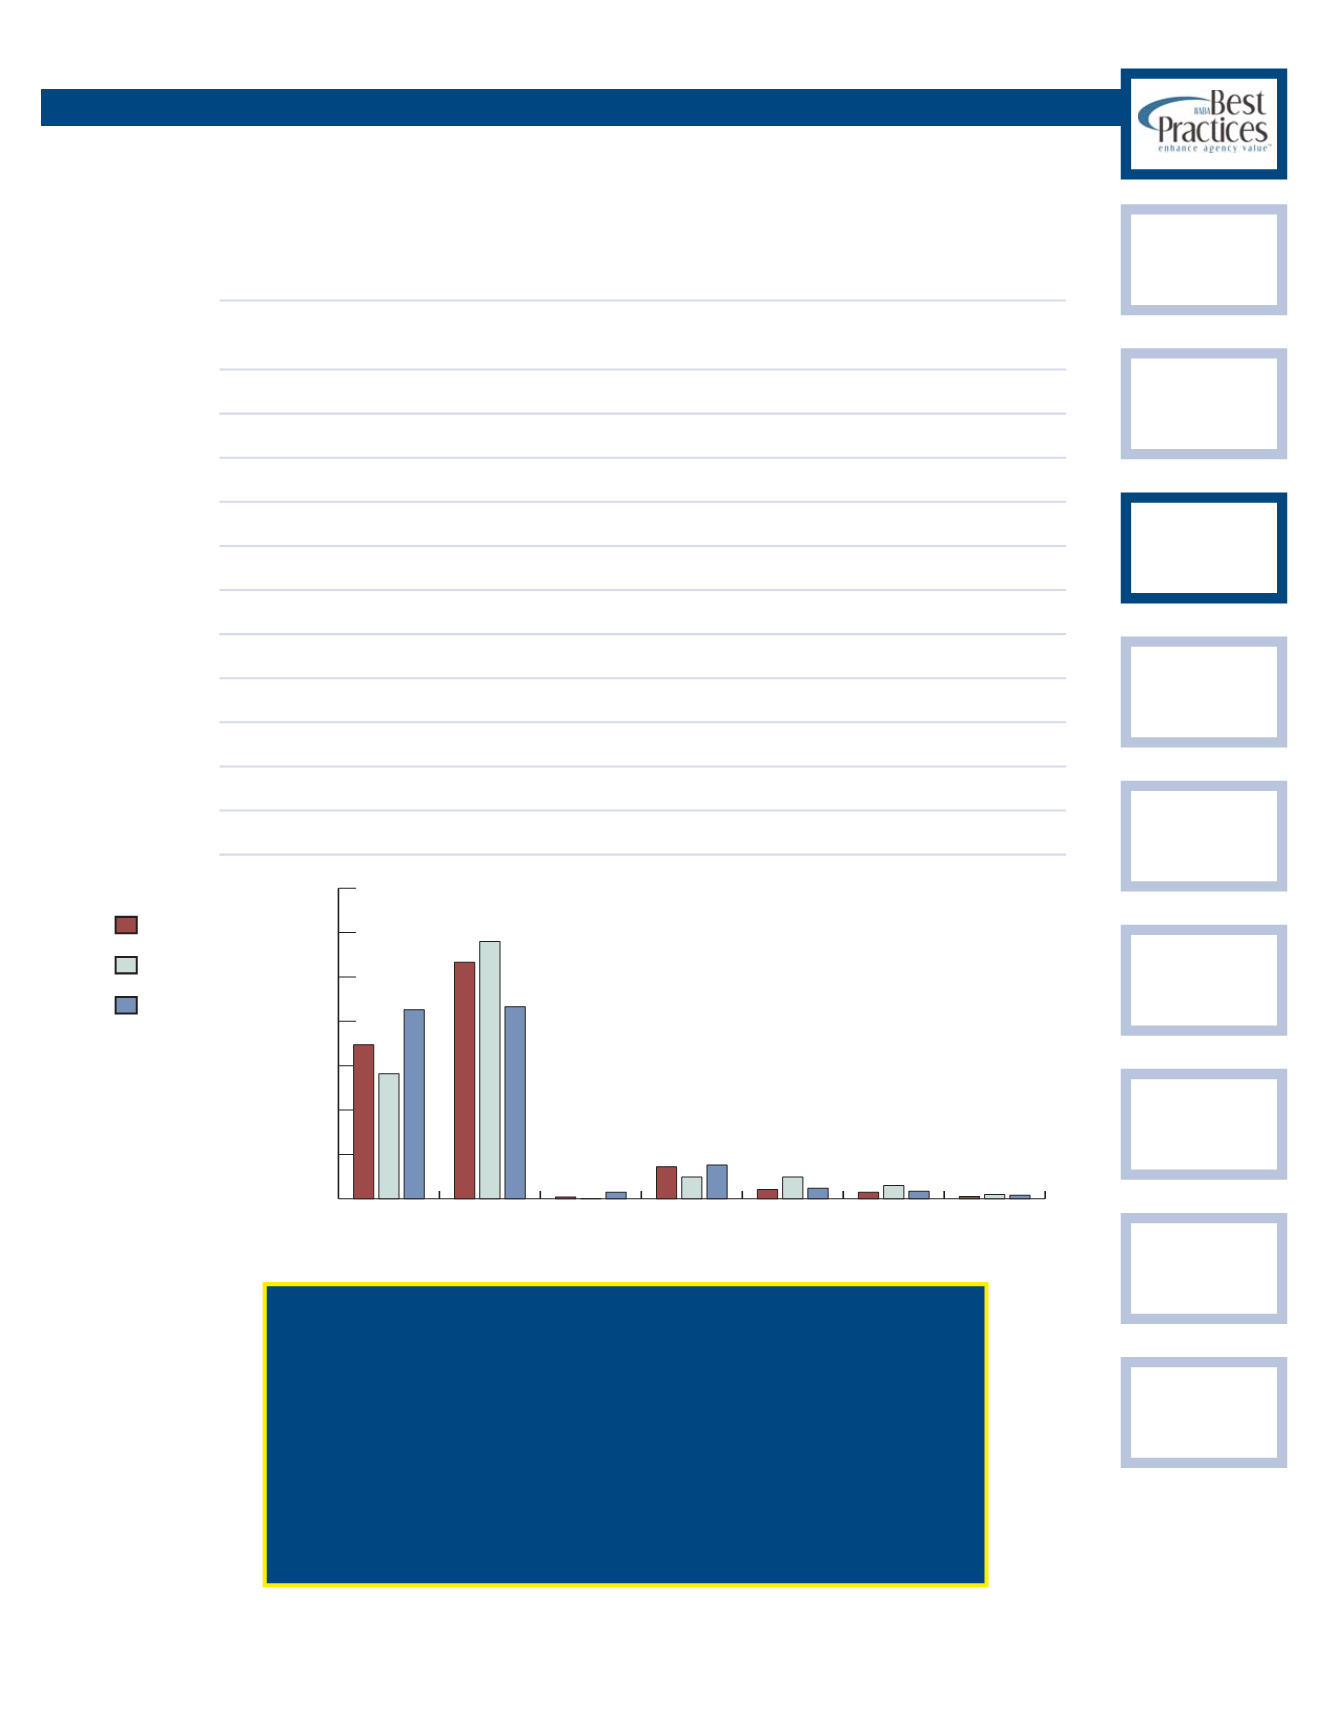
REVENUE ANALYSIS
A.
% of Revenue by Source
AGENCIES WITH REVENUES UNDER $500,000
2006
PROFILE
REVENUES/
EXPENSES
FINANCIAL
STABILITY
EMPLOYEE
OVERVIEW
PRODUCER
INFO
SERVICE
STAFF
INFO
TECHNOLOGY
INSURANCE
CARRIERS
3
Average
+25%
Profit
+25%
Growth
Commercial P&C
34.7%
28.2%
42.6%
Personal P&C
53.3%
58.0%
43.3%
P&C Service Fees
0.4%
0.0%
1.5%
Contingent
7.2%
4.9%
7.6%
Group L&H
2.1%
4.9%
2.4%
Individual L&H
1.5%
3.0%
1.7%
Investments
0.5%
1.0%
0.8%
Miscellaneous
0.2%
0.0%
0.2%
Total Revenues
100.0% 100.0% 100.0%
Brokerage Commission Exp
1.4%
0.0%
0.0%
Net Revenues
98.6% 100.0% 100.0%
% Total Revenue
Average
+25% Profit
+25% Growth
70%
60%
50%
40%
30%
20%
10%
Commercial
P&C
Personal
P&C
P&C Service
Fees
Contingent
Group
L&H
Individual
L&H
Investments
2006 Best Practices Study
Future Revenue Sources
% of Agencies Considering Line of Business as Very Important:
Personal Lines
86.7%
Small Commercial Lines
80.0%
Individual Life & Health
0.0%
Group Life & Health
0.0%
Surety & Bonding
26.7%