


 14 / 48

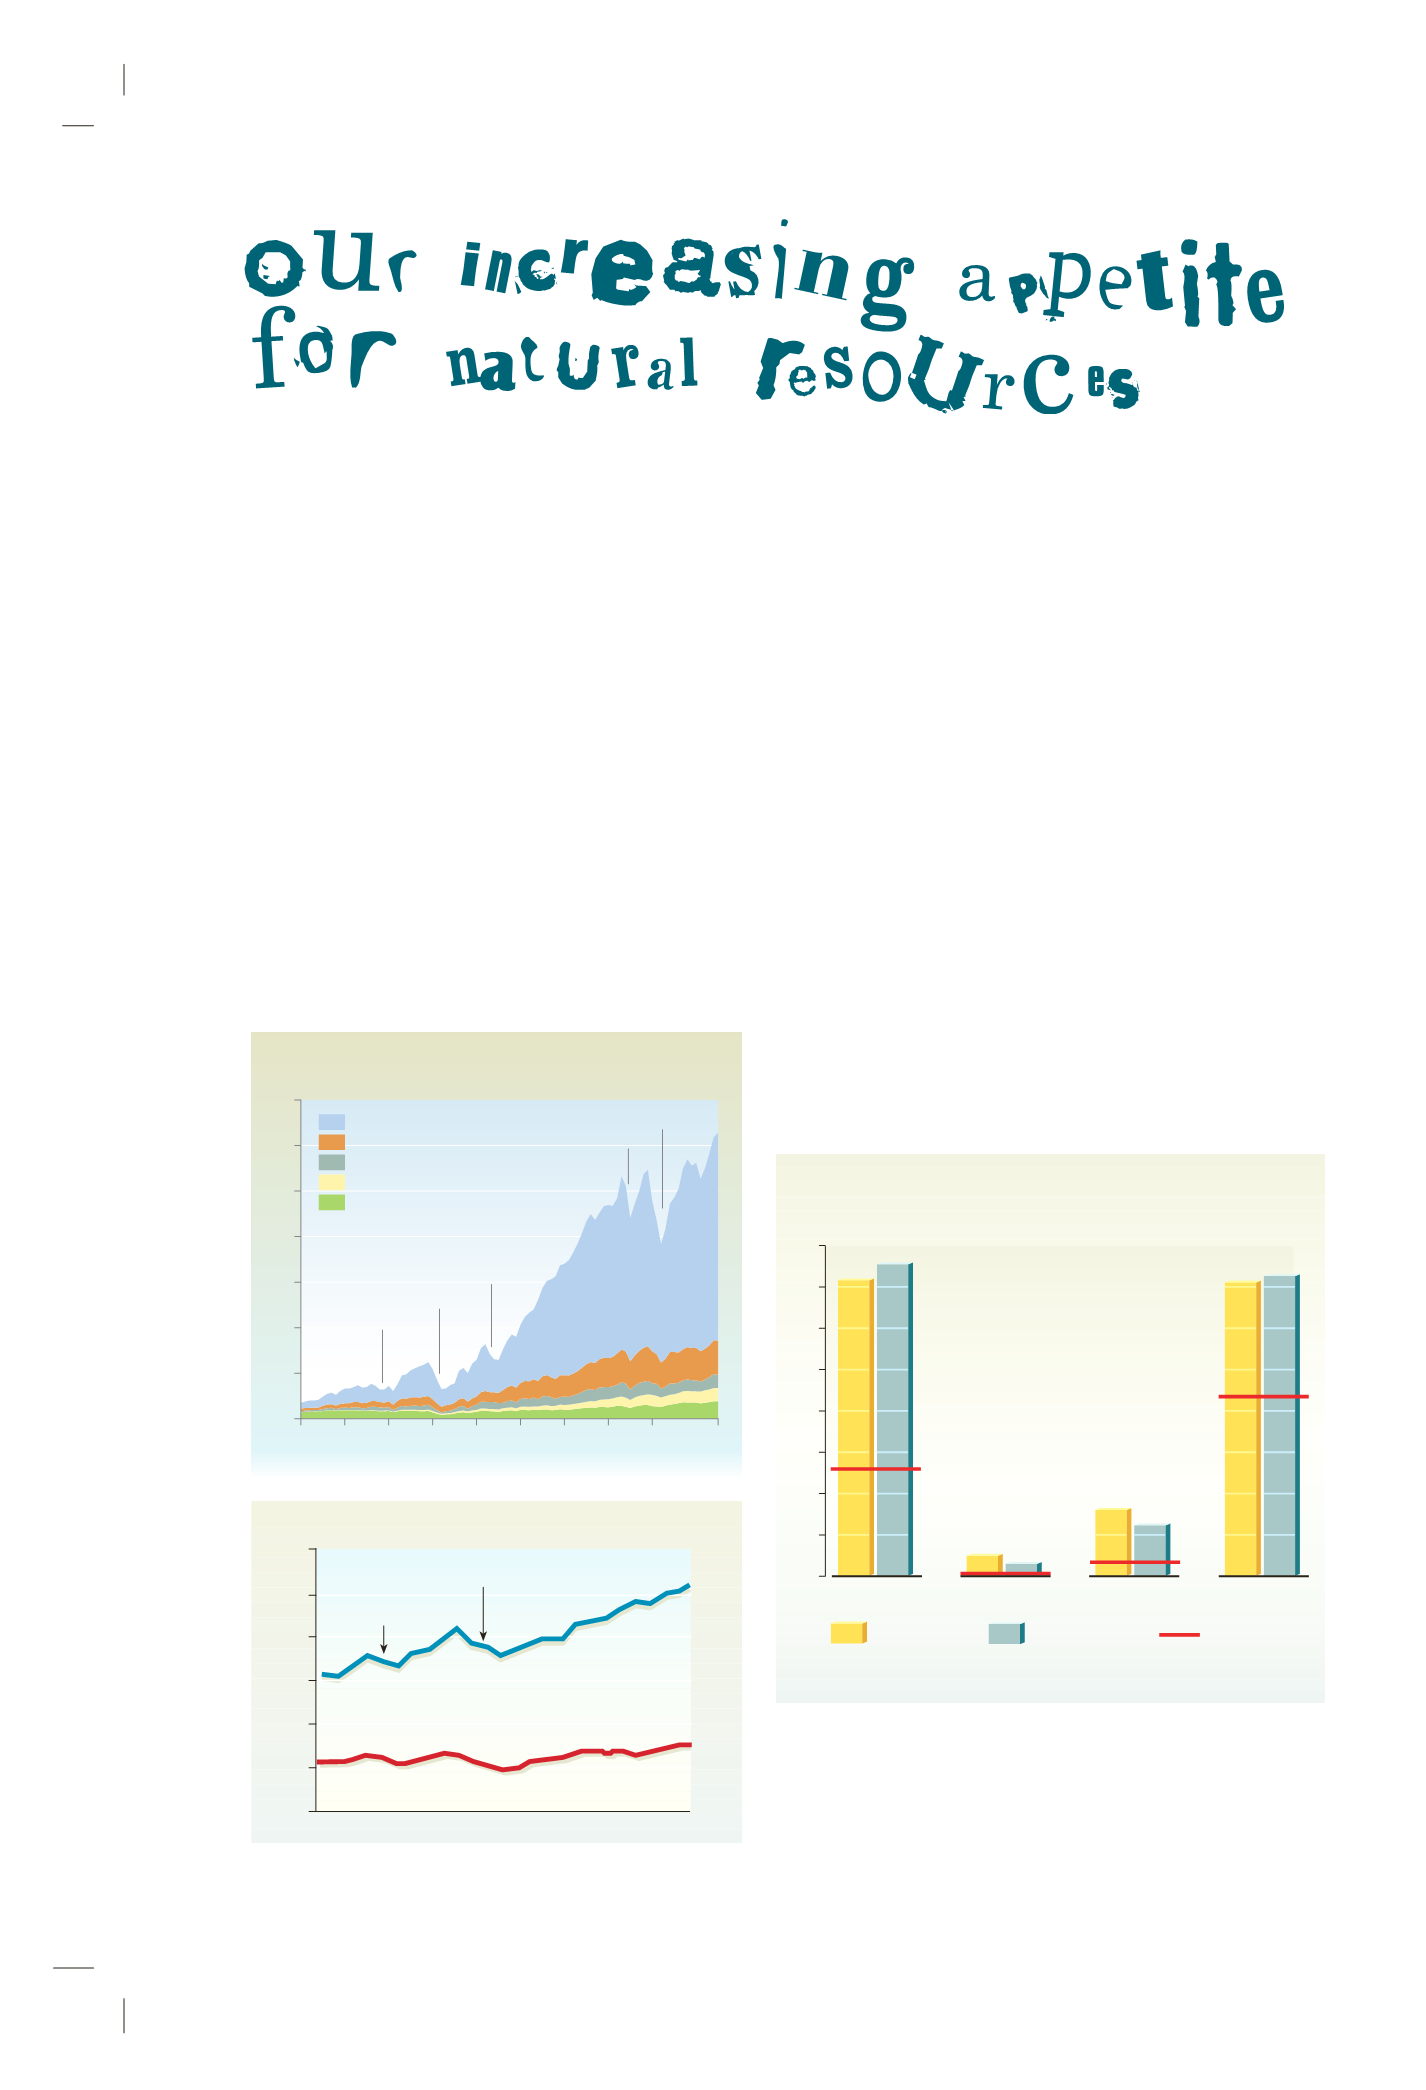
1900 1910 1920 1930 1940 1950 1960 1970 1980
1995
0
500
1 000
1 500
2 000
2 500
3 000
3 500
Great depression
World War I
Oil crisis
Recession
World War II
Construction materials
Industrial minerals
Metals
Non renewable organics
Agricultural and forestry products
Million tonnes
Raw materials consumption in the United States
Source: USGS
How big is your pile?
Imagine a truck delivering to your house each morning all
the materials you use in a day, except food and fuel. Piled at the front door are
the wood in your newspaper, the chemicals in your shampoo, and the plastic in
your grocery bags. A day’s portion of the metal in your appliances and car, plus
your daily fraction of shared materials, such as the stone and gravel in your office
walls and in the streets you stroll. At the base of the pile are materials you never
see, including the nitrogen and potash used to grow your food, and the earth and
rock under which your metals and minerals were once buried.
Worldwatch Institute, Washington DC.
“
Raw material demand trends
The global consumption of key raw materials is rising fast.
Over the 20-year period ending in 1994, the world population
increased by 40% – in that same period, the world consump-
tion of cement increased by 77%, and plastics by just under
200%… Among raw materials used for construction, only
crude steel registered a growth rate that was significantly
lower (only 3% from 1974 to 1994) than the rate of population
increase. (University of Minnesota, 1999).
Raw material consumption facts
A small minority of rich countries are responsible for a large part
of the raw material consumption. All together the developed
countries comprise only 22% of the world population, but they
consume more than 60% of the industrial raw materials.
„
WASTE FROM CONSUMPTION AND PRODUCTION
400
200
50
300
250
150
100
0
Kg per person per year
350
Selected raw material consumption in
United States and Western Europe
Steel
129 Kg
Aluminium Plastics
Cement
3 Kg
15 Kg
222 Kg
Source : University of Minnesota.
United States
Western Europe
World average
1970
1975
1980
1985
1990
1995
Material use
0
2
4
6
8
10
12
Oil Crisis
Recession
Billion tonnes
United
States
World
Source: USGS