


 9 / 48

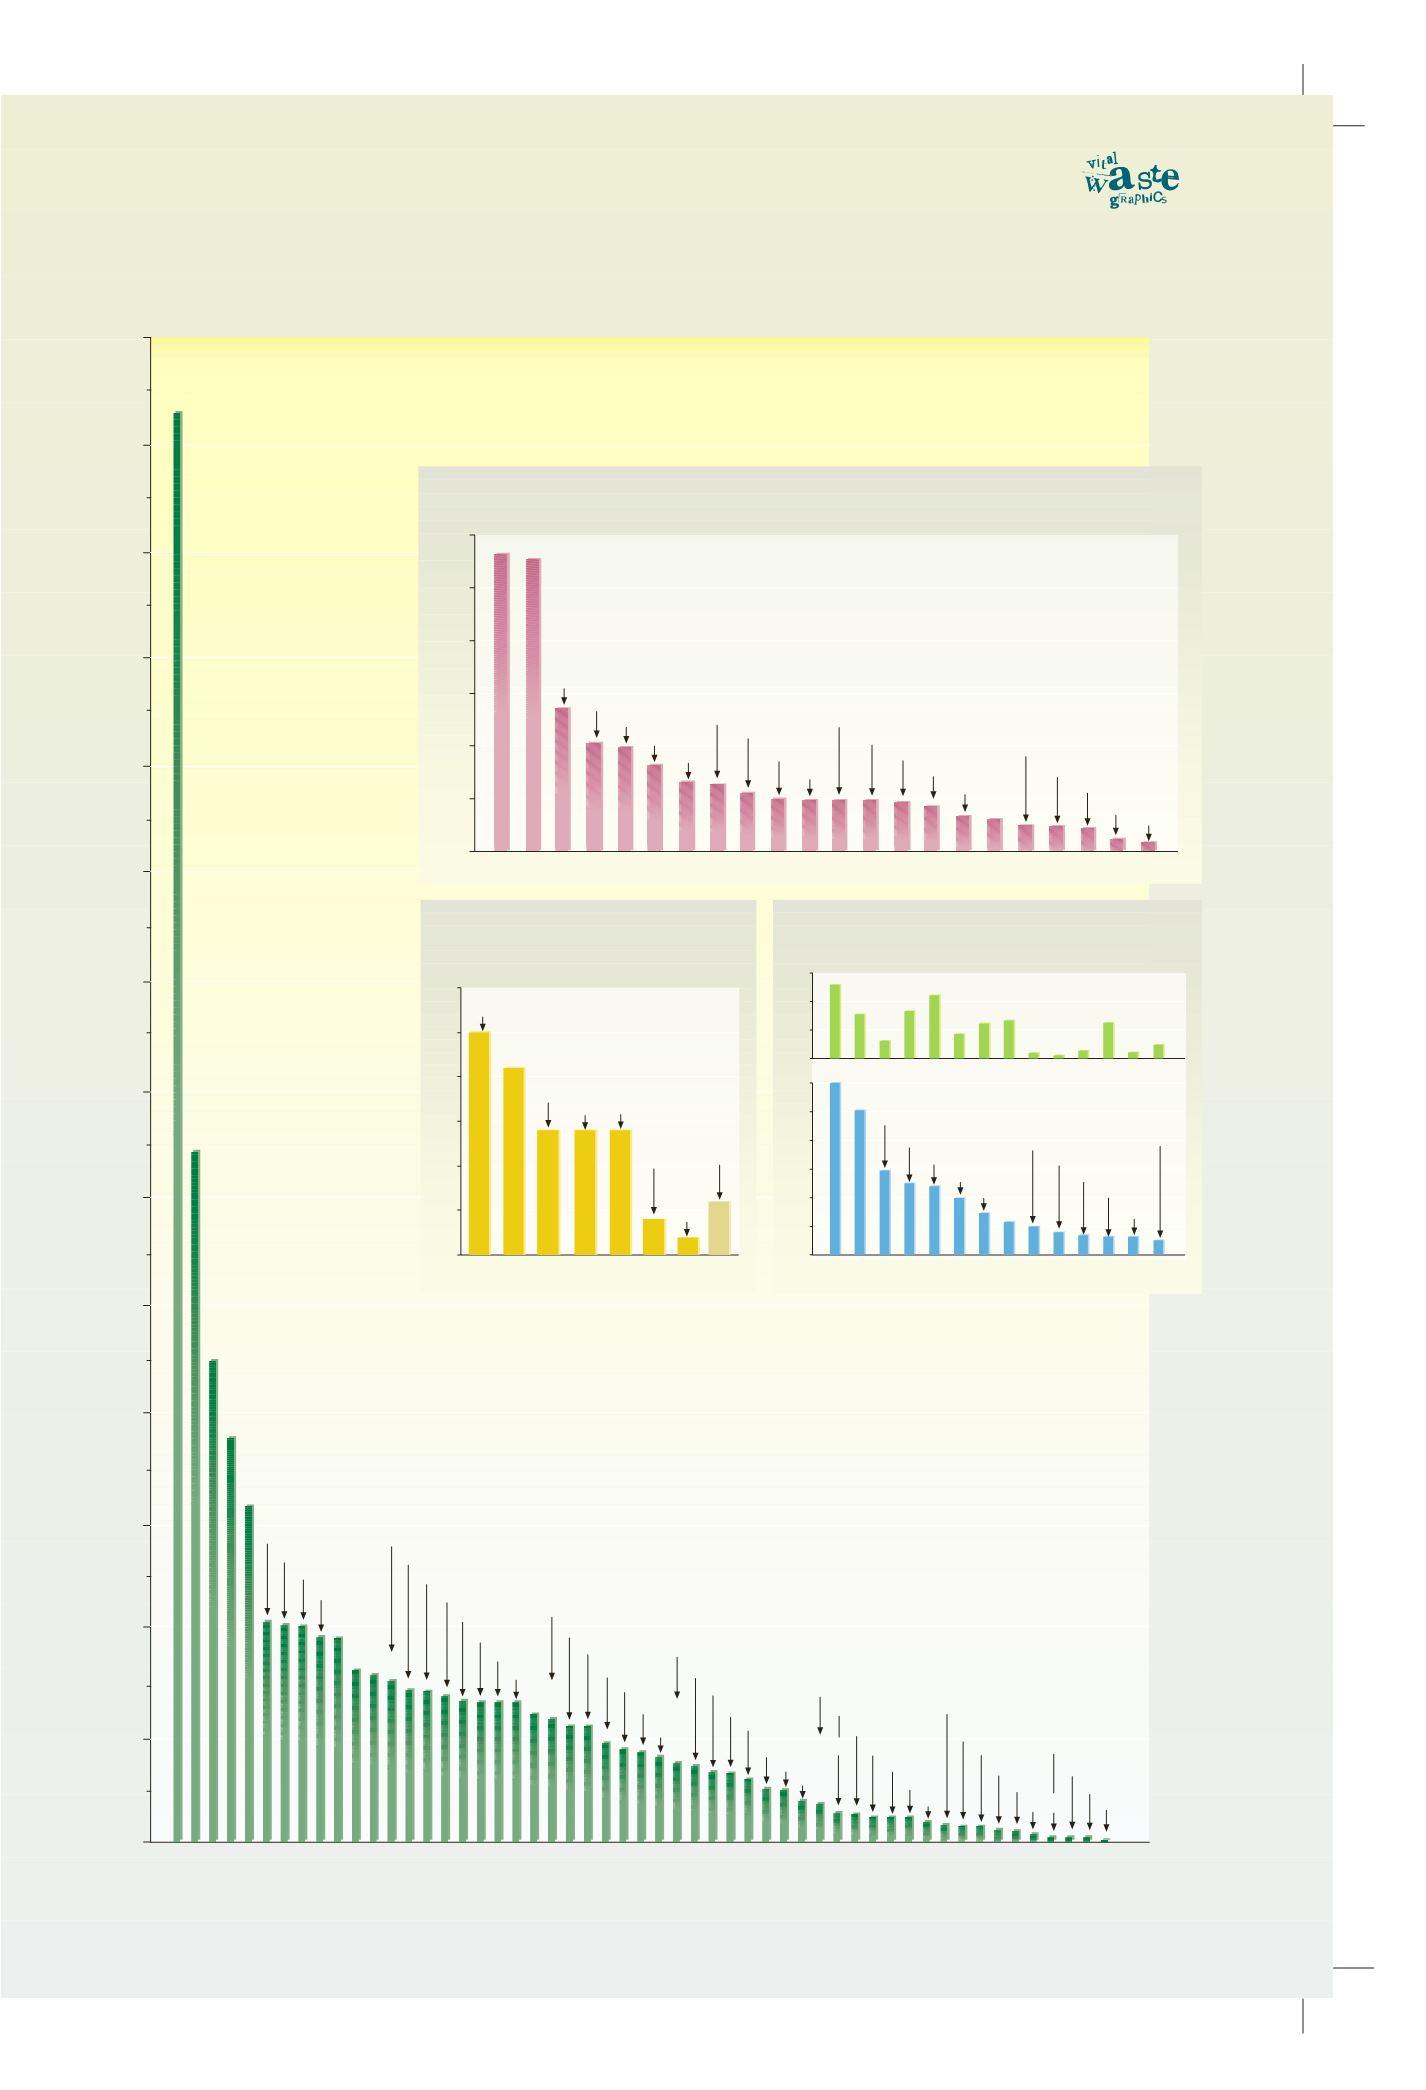
Total hazardous and other waste generation as reported by the Parties
to the Basel Convention in 2001
Kg per person per day
6
5
7
8
9
10
11
12
13
14
4
3
2
1
0
Estonia
Monaco
Ukraine
Kyrgyzstan
Uzbekistan
Denmark
Finland
Singapore
Slovakia
Czech
Republic
Malta
Spain
Saint Lucia
Portugal
Ireland
Belarus
Hungary
Iceland
Lithuania
Latvia
Morocco
Maldives
Niger
United Kingdom
Macedonia
Benin
Georgia
Croatia
China
Cyprus
Italy
Kuwait
Bulgaria
Switzerland
Norway
South
Korea
Cuba
Germany Romania
Luxembourg
Poland
The Netherlands
Andora
Austria
Tunisia
Slovenia
Australia
Thailand
Malaysia
Iran
Bahrain
Source : Basel Convention, 2001.
Sri Lanka
Israel
8
9
Sweden
Manufacturing and municipal waste generation
in selected OECD countries
Million tonnes
Japan
France
Poland
United Kingdom
Germany
South Korea
Spain
Italy
Finland
Belgium
Turkey
Portugal
The Netherlands
20
40
60
80
100
120
0
20
40
60
0
Source: OECD 2002
Manufacturing waste
Municipal waste
Total waste generation in selected OECD countries in mid-1990s
Kg per person per year
20
40
60
0
Source: OECD 2002
Sweden
Japan
Poland
United Kingdom
Germany
South Korea
Spain
Finland
Belgium
Portugal
The Netherlands
Ireland
Hunragy
Austria
Czech Rep.
Slovakia
Greece
Denmark
Switzerland
Norway
Iceland
Luxemburg
50
30
10
30
25
20
15
10
5
0
Total waste generation in OECD
countries, mid-1990s
Source : OECD 1999
Manufacturing
(1000 Mt)
Agriculture and forestry
(800 Mt)
Mining
(550 Mt)
Const-
ruction
(550 Mt)
Municipal
waste
(550 Mt)
Energy
production
(170 Mt)
Water
purifi-
cation
(100 Mt)
Other
(260 Mt)
Figures in brackets are
in milion tonnes (Mt)
Percentage of total waste generation