


 4 / 48

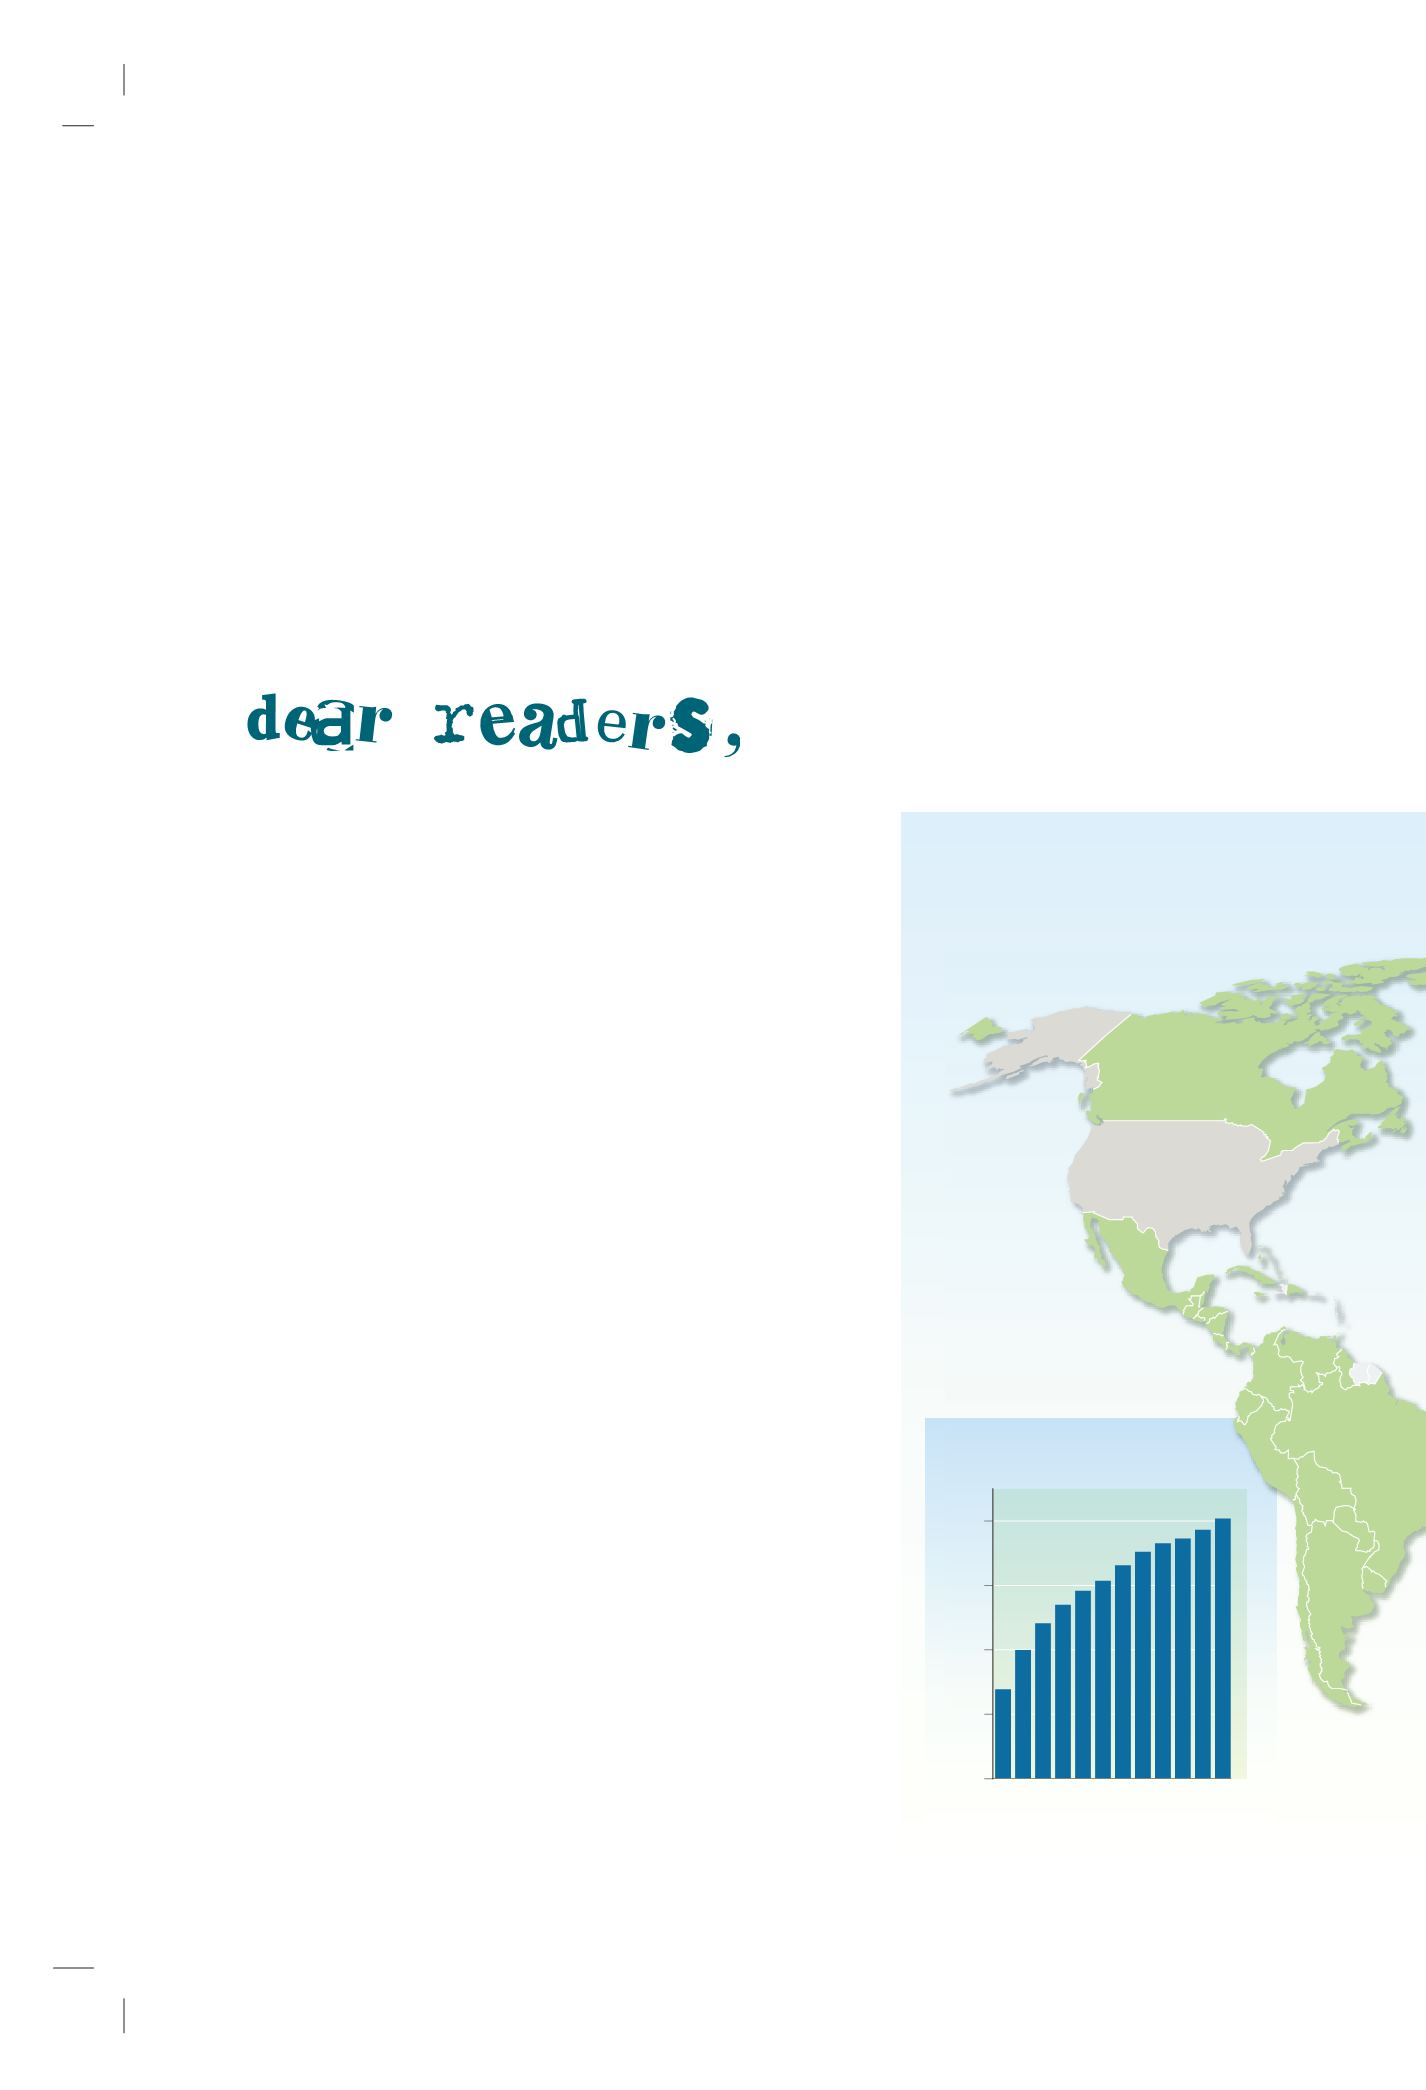
0
40
80
120
160
1993 1996 1998 2000 2002 2004
Number of member countries
How many Parties since 1993?
Source: Basel Convention
welcome to
Vital Waste Graphics
. This publication has
been prepared by the United Nations Environment Pro-
gramme (UNEP) in collaboration with the Secretariat of
the Basel Convention on the Control of Transboundary
Movements of Hazardous Wastes and Their Disposal.
It is clear that the data used and the definitions employed
by the various “sources”, and other crucial factors such as
reporting capacity and compliance, varies considerably
between organizations and countries. This may lead in
some cases to particular graphs and graphics that appear
counter-intuitive. In some cases this is simply because
some countries have reported accurately even when it
contrasts them negatively with countries that have not
reported at all or have reported using different definitions.
The document has been produced to raise awareness
of the global waste challenge and stimulate debate. It
helps to draw attention to the pressing need to improve
national reporting capacity and to improve international
reporting systems. If it does nothing more than this, it will
be a major contribution to an important global challenge.
As data collection systems, definitions and reporting
methodologies improve over time, so too will the quality
and usefulness of this approach, and the quality of the
debate it supports. In the meantime, please enjoy this
work, join this debate, and think about how you can con-
tribute to meeting the global waste challenge.
INTRODUCTION