


 8 / 48

0
10
30
20
40
50
60
Million tonnes
70
80
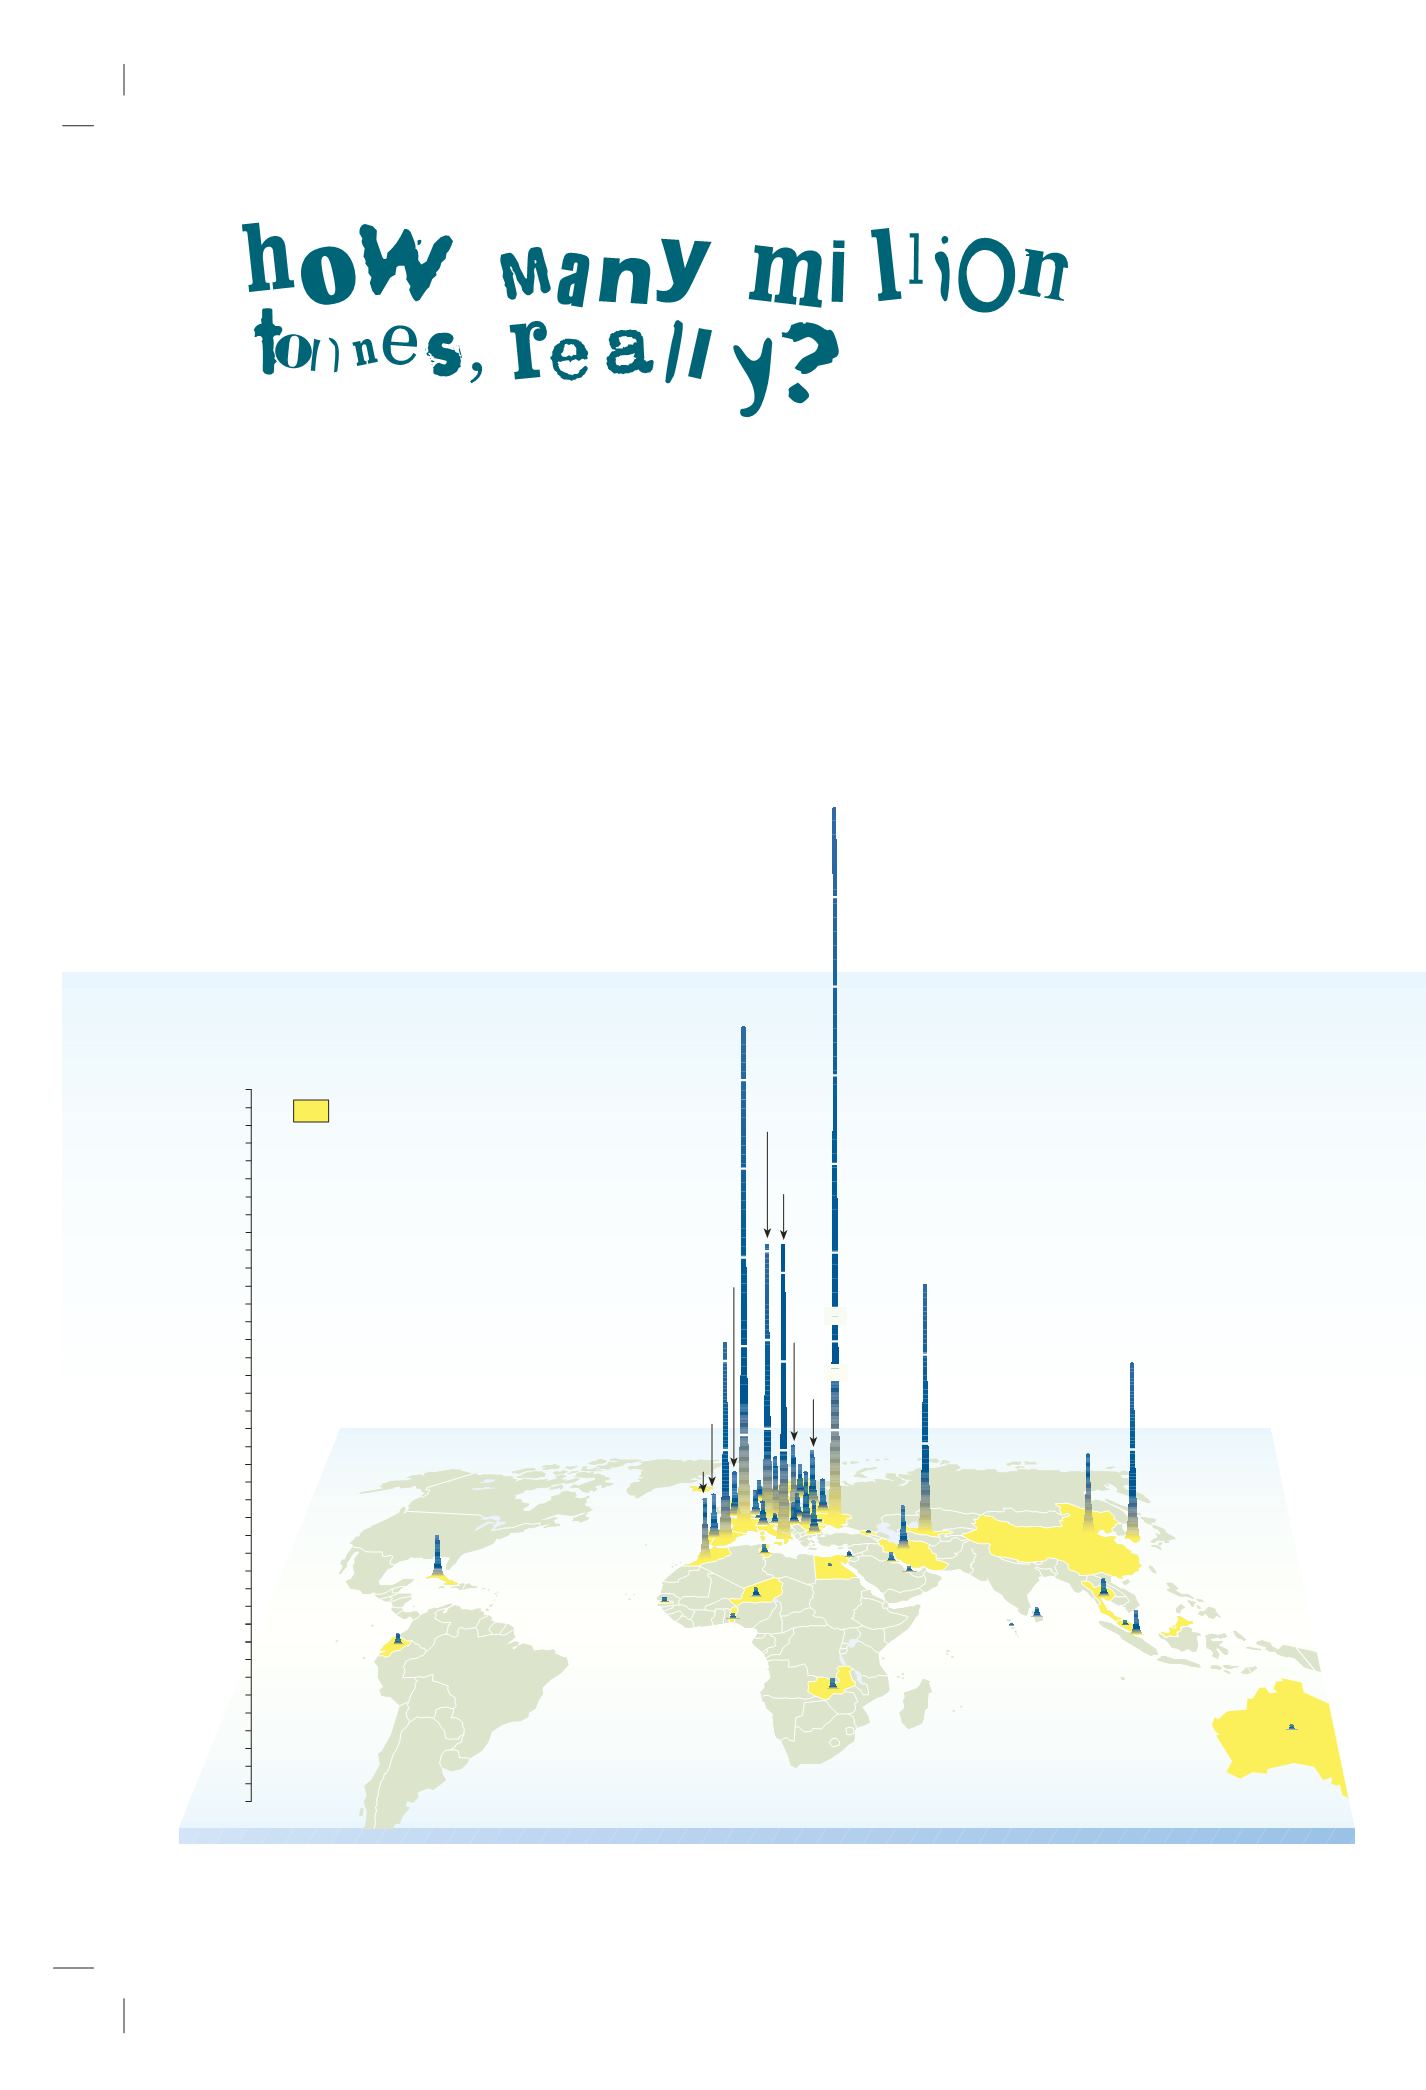
Countries that have reported
waste generation to the Basel
Convention in 2000 or 2001
1. All figures are from 2001 exept for Armenia,
Ecuador, Egypt, Estonia, France, Gambia, Ireland,
Sweden and Zambia for which figures are from 2000.
Ukraine
80
Italy
33,7
Korea
20,5
Chine
9,5
Singapour
3
Iran
5,2
Uzbekistan
28,5
Cuba
4,7
Thailand
1,7
Estonia
6,6
Czech Republic
7
Germany
32
France
56
Spain
22,3
Portugal
4,7
Morocco
7,5
United Kingdom
5,6
Total hazardous and other waste generation
as reported by the Parties to the
Basel Convention in 2001
1
On a global scale, calculating the amount of waste being generated presents
a problem. There are a number of issues, including a lack of reporting by many
countries and inconsistencies in the way countries report (definitions and sur-
veying methods employed by countries vary considerably). The Basel Con-
vention has estimated the amount of hazardous and other waste generated
for 2000 and 2001 at 318 and 338 millions tonnes respectively. However these
figures are based on reports from only a third of the countries that are cur-
rently members of the Convention (approximately 45 out of 162). Compare this
with the almost 4 billion tonnes estimated by the Organisation for Economic
Co-operation and Development as generated by their 25 member countries
in 2001 (Environmental Outlook, OECD) and the problems of calculating a de-
finitive number for global waste generation are obvious. Therefore the figures
shown below should be used with caution.
WASTE GENERATION